Hiromichi Shiotsu*1, Daisuke Sueta*2, Satoru Shinriki*3, Mikuri Ryu*1, Hiroki Usuku*2,4, Megumi Nakata*2, Takeshi Uchiumi*1, Kenichi Tsujita*2, Hirotaka Matsui*5,6
Cite
Shiotsu H, Sueta D, Shinriki S, Ryu M, Usuku H, Nakata M, Uchiumi H, Tsujita K, Matsui H. miR-4485-5p in large extracellular vesicles as a new potent biomarker for diagnosis of deep vein thrombosis. Lab Med Int 2024; 3(3): 95-107. doi: 10.51041/lmi.3.3_95
Original
Lab Med Int 2024; 3(3): 95-107
Correspondence: Department of Health Sciences, Graduate School of Medical Sciences, Kyushu University, 3-1-1 Maidashi Higashi-ku, Fukuoka, 812-8582, Japan E-mail: shiotsu.hiromichi.566″@”m.kyushu-u.ac.jp
Received February 5, 2024; accepted August 22, 2024
*1 Department of Health Science, Graduate School of Medical Sciences, Kyushu University
*2 Department of Cardiovascular Medicine, Graduate School of Medical Sciences, Kumamoto University, Kumamoto, Japan
*3 Department of Molecular Laboratory Medicine, Faculty of Life Sciences, Kumamoto University, Kumamoto, Japan
*4 Department of Laboratory Medicine, Kumamoto University Hospital, Kumamoto, Japan
*5 Department of Laboratory Medicine, National Cancer Center Hospital, Tokyo, Japan
*6 Department of Medical Oncology and Translational Research, Graduate School of Medical Sciences, Kumamoto University, Kumamoto, Japan
ABSTRACT
Deep vein thrombosis (DVT) is a pathological condition where blood clots form in the veins deeper than the fascia, sometimes leading to serious complications such as pulmonary embolism. DVT is a significant complication of cancer; given the situation where the frequency of cancer is predicted to increase, early diagnosis and intervention of DVT are crucial. Current diagnostic methods, such as blood D-dimer test and ultrasonography of the lower limbs, have limitations in terms of specificity and sensitivity.
In this study, we focused on large extracellular vesicles (LEVs) in the plasma of DVT patients and investigated whether microRNAs (miRNAs) enriched in these LEVs could serve as new biomarkers. While the total number of LEVs in patients with DVT was comparable to the control group, there was an increase in platelet-derived LEVs. Specifically, 13 miRNAs were decreased while 4 miRNAs were increased in LEVs in DVT patients (DVT LEVs), among which miR-4485-5p showed a significant 10.9-fold increase, demonstrating a good diagnostic performance for DVT with an area under the curve of 0.81.
Overexpression of miR-4485-5p in human umbilical vein endothelial cells (HUVEC) led to the suppression of tissue plasminogen activator, a predicted target of miR-4485p and a key component of the fibrinolytic system. Additionally, co-culture of HUVEC with DVT LEVs resulted in increased intracellular miR-4485-5p. These findings suggest that miR-4485-5p in platelet-derived LEVs could serve as a valuable biomarker for DVT and may contribute to thrombus formation by suppressing the fibrinolytic system.
〔Lab Med Int 2024; 3(3): 95-107〕
Key Words
microRNA, Deep vein thrombosis, Extracellular vesicles, Biomarker
I. Introduction
Deep vein thrombosis (DVT) is a condition characterized by the formation of thrombosis in the deep veins of the lower limbs and pelvis 1). The development of a thrombus in more central veins, such as the vena cava, can lead to a life-threatening condition known as pulmonary thromboembolism (PE). DVT and PE are collectively referred to as venous thromboembolism (VTE) 1).Virchow’s triad, comprising venous stasis, endothelial injury, and hypercoagulability, is a well-established risk factor for VTE 2). Cancer patients, in particular, are at an increased risk of developing DVT due to the elevated blood coagulopathy, a phenomenon known as cancer-associated thrombosis 3), 4). Indeed, an analysis of patients with acute VTE has revealed that active cancer or a history of cancer is a predominant risk factor, accounting for 31% of all cases 5). Furthermore, cancer patients with metastases face a significantly higher risk of VTE, up to 19.8 times higher than those without metastases, due to increased hypercoagulability of the blood 6), 7). As the global population continues to age, the prevalence of cancer is predicted to rise, leading to an anticipated increase in the number of patients experiencing VTE in the near future 1), 8).
DVT is typically diagnosed through venous ultrasonography of the lower limbs, following the exclusion of obviously negative cases using a blood D-dimer test 9). While the blood D-dimer test exhibits high sensitivity for DVT diagnosis, its specificity is relatively low 9). One possible contributing factor to this limitation is the age-related increase in blood D-dimer levels, with extremely low specificity observed in patients aged 70 and 80 years or older at 22% and 9%, respectively 10). Additionally, reduced specificity is noted in cancer cases, where 46% of patients with abdominal malignancies but without DVT display values exceeding the conventional cutoff of 0.5 ng/mL 11). In addition, the blood D-dimer test is not ideal for screening purposes for DVT diagnosis, as it can be elevated in conditions such as inflammation, infection, trauma, and surgery 9). Although venous ultrasonography demonstrates high diagnostic performance, challenges include unstable delineation of deep veins and reliance on operator expertise and equipment performance for accurate diagnosis 9). Therefore, the identification of a novel biomarker for DVT diagnosis, characterized by significant specificity and consistent diagnostic accuracy, is of paramount importance.
To enhance the diagnostic accuracy of DVT, the study focused on large extracellular vesicles (LEVs) released from vascular endothelium, monocytes, and activated platelets 12), 13). Elevated levels of LEVs are observed in patients with DVT, cancer, and inflammation 14)-18). The increase in LEV levels is presumed to contribute to blood coagulation by exposing tissue factor (TF) on their surface 19). However, the diagnostic accuracy of DVT based on TF concentration and activity on the LEV surface varies across studies 20), suggesting that measuring TF alone is insufficient for improving diagnostic accuracy.
LEVs also serve as carriers of microRNAs (miRNAs) involved in gene expression suppression 21). Moreover, extracellular vesicles from tumor cells and damaged organs exhibit a unique miRNA profile distinct from that in normal tissues 21), 22). This phenomenon has been observed in various malignancies and diseases, such as prostate cancer, lung cancer, Alzheimer’s disease, and myocardial infarction 21)-23). Consequently, miRNAs in LEVs hold promise as novel clinical biomarkers 21)-23). miRNAs may migrate to other cells, modify gene expression, and regulate the pathogenesis of diverse diseases 23). While some miRNAs have shown utility in the diagnosis of DVT, the mechanisms related to pathogenesis and their association with LEVs have not been thoroughly investigated 24). In line with these observations, the study hypothesized that identifying clinically useful miRNAs in LEVs and elucidating their involvement in DVT pathogenesis could lead to the establishment of new biomarkers.
In this study, we analyzed the number of LEVs collected from DVT patients (referred to as DVT LEVs) and characterized the associated miRNAs. LEVs derived from platelets were found to be significantly increased in the DVT group. A comprehensive analysis of miRNAs extracted from DVT LEVs revealed changes in 17 miRNAs, among which miR-4485-5p showed a significant increase and demonstrated good diagnostic performance in the receiver operating characteristic (ROC) analysis. Functional analysis indicated that overexpression of miR-4485-5p suppressed tissue plasminogen activator (tPA), which is a candidate target of the miRNA, in human umbilical vein endothelial cells (HUVEC). Lastly, co-culture of HUVEC with LEVs recovered from clinical specimens significantly increased intracellular miR-4485-5p.
II. Materials and methods
2.1 Sample Collection
Plasma specimens were collected from 28 DVT patients (10 males and 18 females) (Table 1, 2). The diagnosis of DVT was conducted by well-trained cardiologists according to its diagnostic criteria and confirmed through enhanced computed tomography or lower extremity ultrasound sonography 25). Only new-onset DVT cases were included; cases with initiated treatment or recurrent DVT were excluded from the study. miRNAs were extracted from plasma of 24 out of 28 cases, excluding two instances with severe hemolysis occurred during plasma separation and two cases where the volume of specimens for nucleic acid extraction was insufficient. As a control group, the same analysis was performed on 14 age-matched healthy volunteers (4 males and 10 females).
2.2 Isolation of plasma LEVs and miRNA extraction
Seven mL of peripheral blood was collected in blood collection tubes supplemented with EDTA-Na (Venoject II; Terumo, Tokyo, Japan) and centrifuged for 10 minutes at 1,900g. The collected plasma was stored at −80℃ until RNA extraction. Since this study focused on LEVs with a diameter less than 1,000 nm, previously referred to as ‘microvesicles’ or ‘microparticles’ 26), 1,000 µL of plasma was filtered through a membrane filter with a pore size of 1,000 nm (Membrane Solutions, Texas, USA) and centrifuged for 20 minutes at 17,000g 26). Total RNA was extracted from the LEV pellets using the miRNeasy Plasma/Serum Kit (Qiagen, Hilden, Germany) following the manufacturer’s protocol. As a spike-in control for quantitative analysis, 1 fmol of cel-miR-39, a C. elegans-derived miRNA, was added. The extracted total RNA was stored at −80℃ until further usage.
2.3 Flow cytometry (FCM) analysis
LEVs in the plasma samples (n=5 for the DVT group and n=6 for the control group) were counted by FCM. Isolated LEVs were washed three times with calcium- and magnesium-free Dulbecco’s phosphate-buffered saline (Nacalai Tesque, Kyoto, Japan). LEVs hold identical surface markers to the original cell because the outer layer consists of the cell membrane 26). We stained platelet-derived LEVs with CD31-APC-Cy5 (Biolegend, San Diego, USA) and CD61-FITC (Biolegend) antibodies for identification. Control beads (Spherotech, Lake Forest, USA) were added for size control. Stained LEVs were measured by FACS Verse (BD Biosciences, New Jersey, USA). Particles smaller than the size control beads with a diameter of 1,000 nm were counted as LEVs.
2.4 Microarray analysis
A 3D-gene miRNA Oligo Chip (Toray, Tokyo, Japan) was employed to generate a comprehensive miRNA profile in DVT LEVs. The signal intensities obtained for each well were corrected using the 75th percentile signal intensities, which were further normalized by conversion to log2 values. A heat map and a volcano plot were generated with a cut-off of at least a 2-fold change in miRNA expression and a p-value of less than 0.05 by Welch’s t-test. R (4.2.0) and gplots package (3.1.3) were utilized to generate the heat map and volcano plot 27).
2.5 Real-time quantitative PCR (RT-qPCR) analysis of miRNAs
Candidate miRNAs for DVT biomarkers were analyzed by RT-qPCR. Equal amounts of total RNA were reverse transcribed using the TaqMan microRNA Reverse Transcription kit (Thermo Fisher Scientific, Massachusetts, USA). Synthesized complementary DNA (cDNA) was then amplified on a DICE TP800BE thermal cycler (Takara, Shiga, Japan) using the Luna Universal Probe qPCR Master Mix (New England Biolabs, Massachusetts, USA) and TaqMan MicroRNA Assay (Thermo Fisher Scientific). The PCR reaction conditions were set as follows: enzyme activation at 95℃ for 10 minutes, followed by 40 cycles of 95℃ for 15 seconds and 60℃ for 1 minute. During RNA extraction, 1 fmol of cel-miR-39 was spiked in and used as an exogenous control. The expression levels were calculated from the obtained amplification curves using the comparative threshold cycle (Ct) method, and the values were presented relative to the average of the control group.
2.6 Cell culture
HUVEC, an endothelial cell-derived cell line, was obtained from the JCRB Cell Bank (Osaka, Japan) and cultured in DMEM/HAM’s F12K medium (FUJIFILM Wako Pure Chemical, Osaka, Japan) supplemented with 10% fetal bovine serum, 50 µg/mL endothelial cell growth supplement (FUJIFILM Wako Pure Chemical), and 100 µg /mL heparin (FUJIFILM Wako Pure Chemical) at 37℃ with 5% CO2.
2.7 Transfection of miRNA mimic and inhibitor into HUVEC
HUVEC was transfected with mirVana miR-4485-5p inhibitor and mimic (each from Thermo Fisher Scientific) using Lipofectamine RNAiMAX (Thermo Fisher Scientific). The concentrations of the inhibitor and mimic were set at 10, 30, and 50 nM per well. Cells were collected 24 hours after transfection, and protein and RNA were extracted from the cells.
2.8 RT-qPCR analysis of candidate miRNA target genes
mRNA expression in HUVEC was measured by RT-qPCR. An equal amount of RNA was first reverse transcribed with the PrimeScript RT-PCR kit (Takara). The cDNA was amplified using TB Green Premix Ex Taq (Takara) under the following conditions: enzyme activation: 95℃, 30 sec; PCR reaction: 40 cycles of 95℃ for 5 sec, and 60℃ for 30 sec. The expression of PLAT (encoding tPA) was measured using the following primers: forward primer: CATATTTCGTGTGCCAGTGC and reverse primer: GACCCATTCCCAAAGTAGCA. IPO8 was used as an internal control with the following primers: forward primer: GGCATACAGTTTAACCTGCCAC and reverse primer: CAGGAGAGGCATCATGTCTGTAA 28). The expression levels were calculated from the obtained amplification curves using the Ct method, and the values were presented relative to the mean of the control group.
2.9 Immunoblotting
HUVEC was harvested, and radio-immunoprecipitation assay (RIPA) buffer was added to the cells, followed by sonication to lyse the cells. The lysed sample was mixed with an equal volume of sample buffer (FUJIFILM Wako Pure Chemical). The mixture was separated on a 10% SDS-PAGE gel and transferred to a polyvinylidene difluoride membrane. The transferred membrane was blocked with Blocking One (Nacalai Tesque) and incubated with an anti-tPA antibody (ab227069, Abcam, Cambridge, UK) or anti-GAPDH antibody (2118, Cell Signaling, Danvers, USA) overnight at 4℃. After incubation, the membrane was washed three times with phosphate-buffered saline (PBS) with 0.1% Tween 20. Subsequently, the membrane was incubated for 2 hours at room temperature with horse radish peroxidase (HRP)-labeled anti-rabbit antibody (1:1,000) (7074, Cell Signaling). Signals were visualized with Western blot hyper HRP substrate (Takara) and analyzed by LAS-2000 (GE Healthcare, Fairfield, USA).
2.10 Co-culture of HUVEC with LEVs isolated from plasma
HUVEC (3.0×10⁴) was adhered to 24-well plates (Corning, New York, USA) and cultured for 24 hours. One hundred thousand FCM-counted LEVs from DVT and control samples were dissolved in 200 µL Opti-MEM (Thermo Fisher Scientific) and added to the culture medium. After 24 hours, the LEVs in the culture medium were removed. HUVEC was collected after washing with PBS and lysed for RNA extraction.
2.11 Statistical analysis
Welch’s t-test was employed to compare the two groups 29), 30). A p-value less than 0.05 was considered significant. The diagnostic performance of miR-4485-5p was determined by the area under the curve (AUC) calculated by ROC analysis. Optimal sensitivity and specificity were determined by the Youden index. R (4.2.0) and pROC package (1.18.0) were used for the analysis 31).
2.12 Ethical Consideration
This study was conducted following approval from the ethics committees of Kumamoto University (Approval No. 2016) and Kyushu University (Approval No. 2020-250). Samples were exclusively collected from individuals who provided written informed consent, and all procedures adhered to the principles of the Declaration of Helsinki. Samples were obtained from adult participants between August 13, 2020, and February 31, 2022.
III. Results
3.1 Characteristics of DVT patients included in the study
Table 1 and 2 present the characteristics of the DVT and control groups. The mean age of the DVT patients was 69.1 years (range: 39-86 years). Coagulation and hematological tests revealed significantly higher blood D-dimer levels in the DVT group (p < 0.001) (Table 1), whereas the red blood cell count (p = 0.005), hemoglobin (p < 0.001), and hematocrit (p < 0.001) were significantly lower in the DVT group.
Among the 28 DVT patients, cancer (n=20, 71.4%) was the most common primary disease in the cohort; two patients (7.1%) had collagen disease, and one patient (3.6%) had varicose veins (Table 2). Collectively, the cases in this study included typical patients with underlying conditions associated with a high risk of developing DVT, thus the selection of subjects was considered appropriate.
3.2 Increased platelet-derived LEVs in DVT patients
The number of plasma LEVs was counted by FCM (n=5 in the DVT group, n=6 in the control group). The total number of LEVs per mL was comparable between the DVT and control groups (Figure 1a). Previous studies have shown that LEVs formed by the platelet (referred to as platelet-derived LEVs) are increased in DVT 32)-34). Indeed, when we labeled platelet-derived LEVs with their respective surface markers, CD31 and CD61, they were significantly increased in the DVT cases (Figure 1b, 1c). This result suggests that the increase in LEVs in DVT was primarily due to release from platelets, although the specificity of CD31 for the marker of platelet-derived LEVs needs further study 34). While, the absolute number of LEVs did not increase, and the degree of increase in CD31- and CD61-positive LEVs was almost equal. This indicates that the increase in LEVs in DVT is more likely to be derived from platelets.
3.3 Increased miR-4485-5p in LEV fraction as a diagnostic marker for DVT
Given the increased platelet-derived LEVs in DVT cases, we hypothesized that their miRNA expression levels might be altered. We conducted a comprehensive analysis of miRNA profiles within LEVs obtained from the plasma of both DVT and control subjects.
Firstly, we performed microarray analysis on samples from five age- and sex-matched subjects each from the DVT and control groups after extracting miRNAs within LEVs. Four out of five DVT patients in this subset also had concomitant cancer. The generated heat map shows clustering based on signal intensity (Figure 2a), and the volcano plot illustrated significant alterations in 4 miRNAs with an increase and 13 miRNAs with a decrease in the DVT group (Figure 2b). These miRNAs that were significantly altered by microarray analysis are shown in Table 3. Given the specific increase of CD31- and CD61-positive LEVs (Figure 1b, 1c), the changes in miRNA level were suggested to be influenced by an increase in platelet-derived LEVs.
We next quantified miR-4485-5p, the miRNA with the most significant increase in the microarray. Nineteen DVT and fourteen control samples, different from those used for microarray analysis, were employed. As expected, the expression level of miR-4485-5p was significantly elevated in the DVT group (10.9-fold higher than in the control group, p =0.008) (Figure 2c). Thus, it was confirmed that miR-4485-5p was markedly elevated by increased platelet-derived LEVs in DVT patients.
Finally, the diagnostic efficacy of increased miR-4485-5p within LEVs for DVT was evaluated using ROC analysis. The AUC of miR-4485-5p in LEVs was 0.81 (95% confidence interval 0.65-0.97), with a diagnostic sensitivity of 0.74 and specificity of 0.94 when the optimal cut-off value was set at 1.825, as determined by the Youden index (Figure 2d). Collectively, increased miR-4485-5p in LEVs was deemed a valuable marker for DVT diagnosis.
3.4 Reduced tPA expression by miR-4485-5p in HUVEC
We then explored the impact of miR-4485-5p on target cells, specifically investigating its effects on candidate target genes. Using miRwalk 35), a target mining tool, we identified 36,713 genes as potential targets; we selected genes highly expressed in venous tissue and involved in the complement and coagulation cascade (KEGG pathway: hsa04610) as promising candidates 36). Among these, PLAT, a gene encoding tPA, emerged as a functional target with sequences complementary to miR-4485-5p in both the 3’UTR and coding region (Figure 3a).
Subsequently, we investigated the expression of PLAT in HUVEC when miR-4485-5p expression was modulated using the miR-4485-5p mimic and inhibitor. Introduction of the miRNA mimic led to a 38.0-fold increase in miR-4485-5p expression in HUVEC, resulting in a 0.68-fold decrease in PLAT expression compared to the control (p =0.02) (Figure 3b, 3d). Conversely, the miRNA inhibitor decreased miR-4485-5p expression in HUVEC by 0.35-fold and increased PLAT expression by 1.46-fold (p =0.03) (Figure 3c, 3e). Additionally, tPA expression, assessed by Western blotting, was significantly reduced by 0.29-fold in HUVEC transfected with the miR-4485-5p mimic (p =0.014) (Figure 3f), although no significant change in tPA protein was observed in HUVEC treated with the miR-4485-5p inhibitor (p =0.24). Previous studies showed that over 90% of the tPA protein produced by HUVECs is secreted extracellularly, with only a minor fraction remaining intracellular 37), 38). Therefore, it is possible that miRNA inhibitor did not contribute to the increase in tPA protein in HUVEC when measured by Western blot analysis. Overall, these findings suggest that an increase in miR-4485-5p exerts an inhibitory effect on tPA expression in vascular endothelial cells.
3.5 Increased miR-4485-5p in HUVEC exposed to LEVs from DVT patients
Finally, we investigated the impact of DVT LEVs on intracellular miR-4485-5p levels in HUVEC. LEVs from three DVT and control samples, with similar particle size distributions as determined by FCM, were selected for the experiment. Two of the three DVT samples were associated with cancer, while the remaining one was linked to collagen disease. We confirmed that miR-4485-5p levels in LEVs from all three DVT cases were more than 2-fold higher than the mean level in the control group (Figure 2c).
Comparing HUVEC co-cultured with LEVs from DVT patients or non-DVT donors to those cultured without LEVs, both groups exhibited a significant increase in intracellular miR-4485-5p levels (by 1.16-fold or 1.23-fold, respectively), but there was no significant difference between the DVT and non-DVT groups (p =0.29) (Figure 4a). These findings suggest that LEVs can elevate miR-4485-5p levels in target cells. Furthermore, the PLAT expression in HUVECs co-cultured with non-DVT LEVs compared to HUVECs cultured without LEVs was 1.51 and 0.97 in those co-cultured with DVT LEVs. The results indicated that DVT LEVs reduced the PLAT expression in HUVECs compared to non-DVT LEVs. However, the difference was not statistically significant (p = 0.099) (Figure 4b). The lack of distinction between the DVT and control groups in this experiment may be attributed to the use of unsorted LEVs instead of purified platelet-derived LEVs due to technical constraints. Western blot analysis of tPA protein could not be performed due to the insufficient recovery of protein extract required for the assay.
Table 1
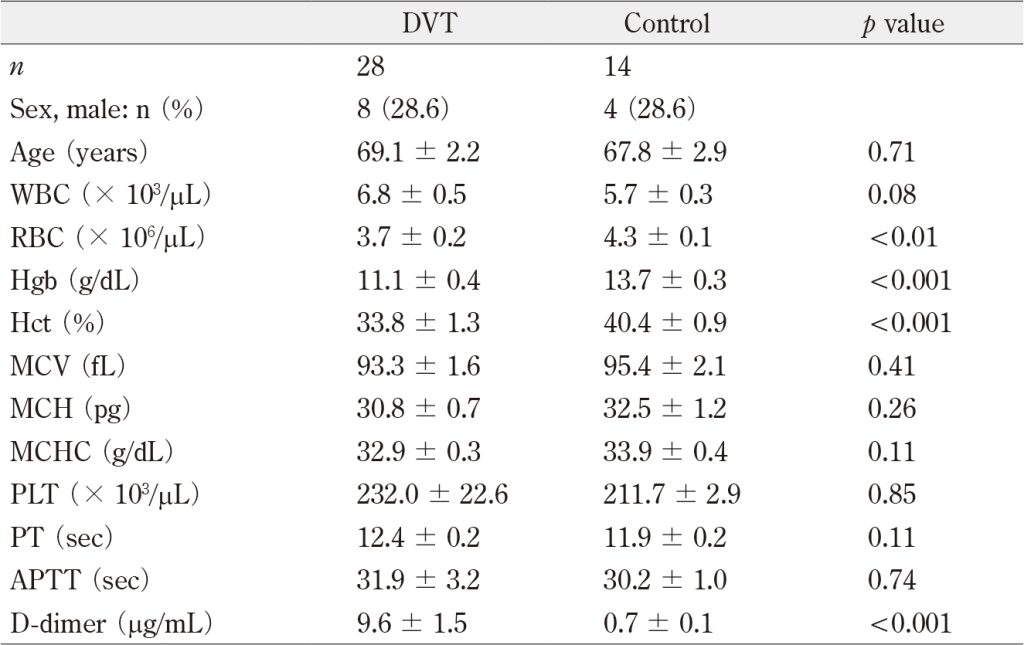
All values are expressed as means ± SEMs.
Table 2
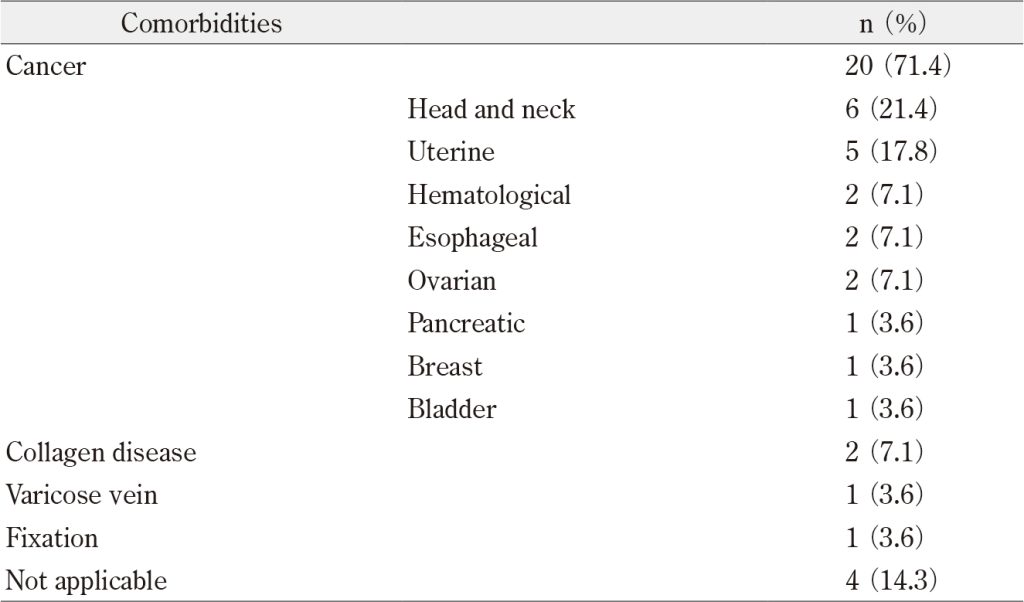
Table 3
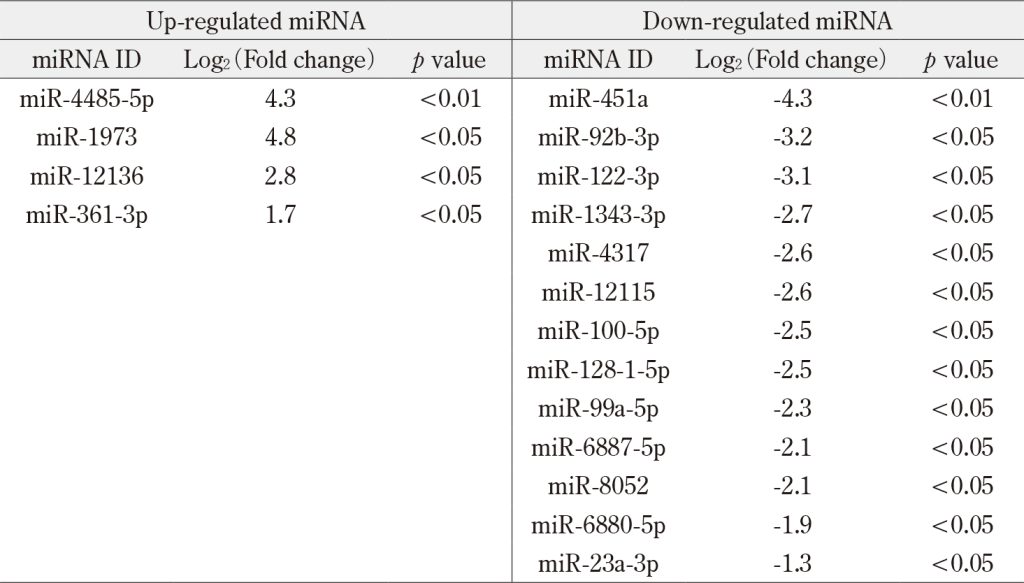
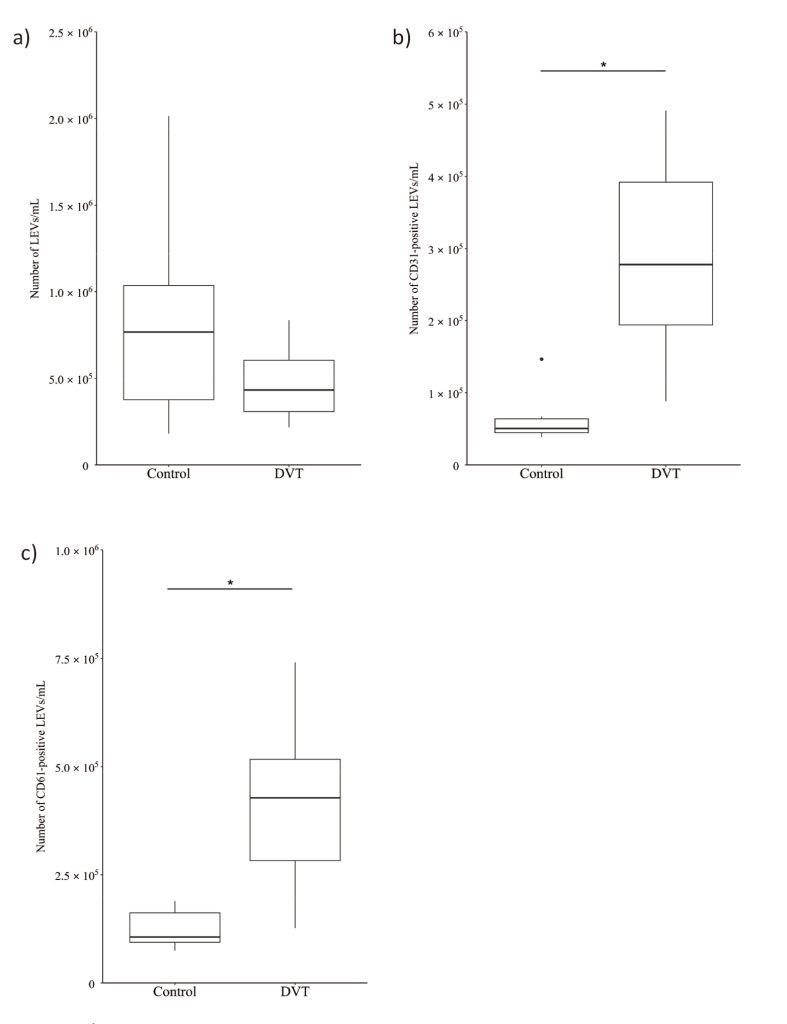
Figure 1 Increased platelet-derived LEVs in plasma of DVT patients
(a) Number of total LEVs. (b and c) CD31- and CD61-positive LEVs in plasma analyzed by FCM. Each value in the graph shows the number of LEVs per mL. (n = 6 for control group and n=5 for DVT group) (* p < 0.05).
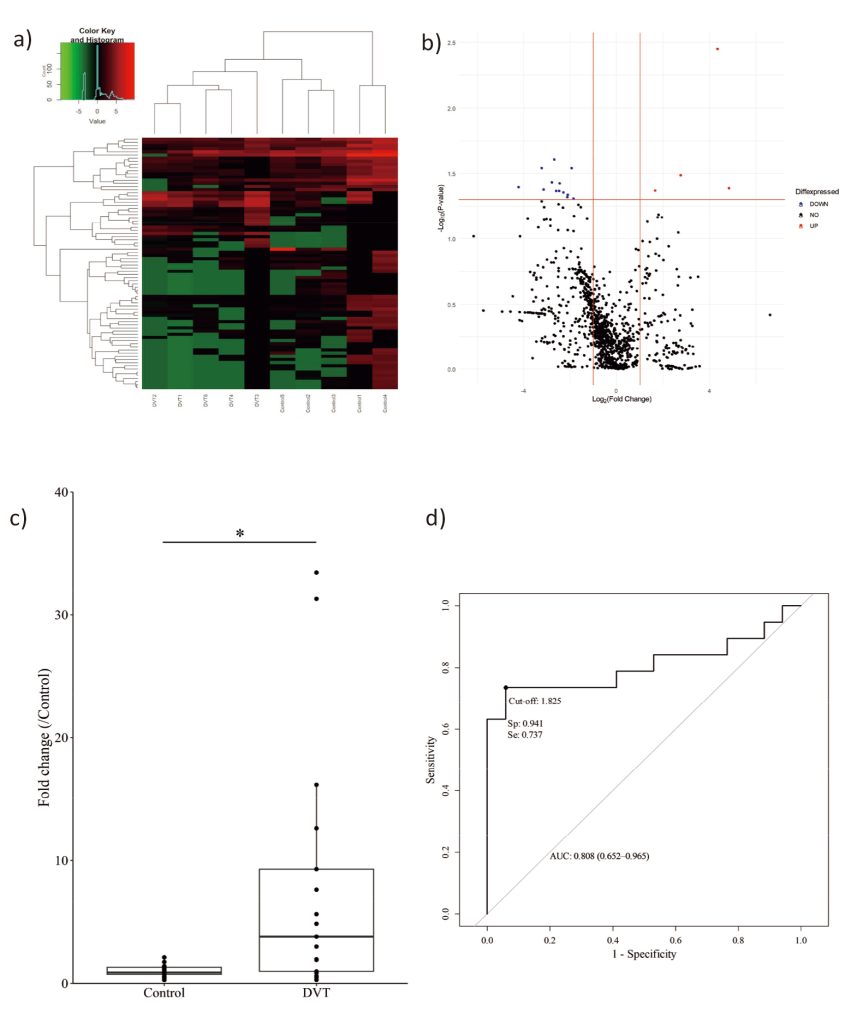
Figure 2 Increased miR-4485-5p LEVs from DVT patients
(a) Heat map of differentially expressed miRNAs in DVT versus control LEVs. Expression levels are shown as color, where red represents high expression level and green represents low in each sample. (b) Volcano plot of microarray analysis. Red lines indicate cut-offs of 1 on the X-axis (fold change > 2.0) and 1.3 on the Y-axis ( p < 0.05). (c) RT-qPCR analysis of miR-4485-5p in LEVs (control n=14, DVT n=19). As a control, 1 fmol of cel-miR-39 was used. The top and bottom edges of the box indicate the first and third quartiles, respectively. The upper and lower whiskers indicate the maximum and minimum values, excluding outliers. (d) Receiver operating characteristic (ROC) analysis of miR-4485-5p for DVT. Sp: specificity, Se: sensitivity (* p < 0.05)
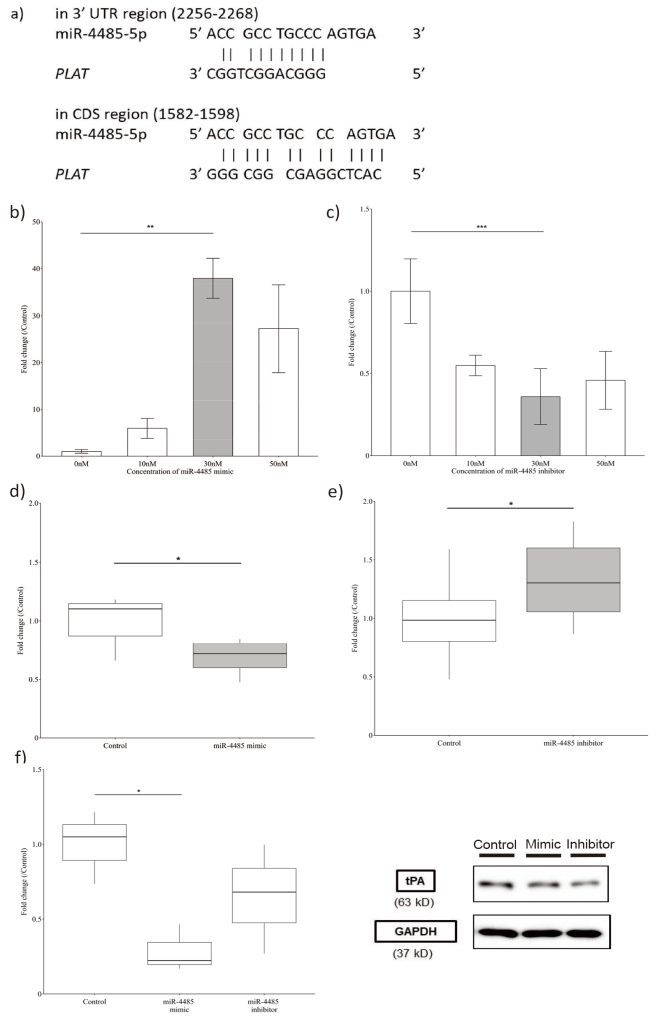
Figure 3 Suppression of tPA by miR-4485-5p in HUVEC.
(a) Binding sites of miR-4485-5p with PLAT, as predicted by miRwalk. (b) miR-4485-5p expression in HUVEC with each concentration of miR-4485-5p mimic (n=3) and (c) inhibitor (n=3). (d) PLAT expression in HUVEC exposed with 30nM miR-4485-5p mimic (n=6) and (e) inhibitor (n=10). (f) Western blot analysis of tPA protein treated with miR4485-5p mimic and inhibitor (n=3). tPA protein in HUVEC treated with miR-4485-5p mimic and inhibitor are corrected for GAPDH to compare with control (* p < 0.05, ** p < 0.01, *** p < 0.001)
IV. Discussion
In this study, the analysis of miRNAs in DVT LEVs aimed to elucidate their significance in the pathogenesis and potential as biomarkers. Among the 17 significantly altered miRNAs in DVT LEVs, miR-4485-5p exhibited notable diagnostic performance for DVT. This miRNA was found to suppress tPA in HUVEC, suggesting its involvement in thrombus formation through the inhibition of the fibrinolytic system.
Notably, the increase in miR-4485-5p levels is suggested to link to impaired mitochondrial function, as evidenced by reduced ATP production and increased reactive oxygen species (ROS) in cells 39)-43). Despite the precise mechanisms connecting increased miR-4485-5p to mitochondrial dysfunction remain unknown, the study showing that vascular tissue in mice with mitochondrial dysfunction exhibited increased levels of both ASncmtRNA-2, a precursor antisense non-coding mitochondrial RNA of miR-4485-5p 40)-43), and miR-4485-5p imply a connection between these and mitochondria regulation 40), 42). In addition, previous study suggests a potential connection between mitochondrial dysfunction and increased LEVs; Burger et al. reported that cells with reduced mitochondrial function produced more LEVs, and conversely, an increase in LEVs significantly reduced mitochondrial function in the cells 44). Overall, this study, in conjunction with existing literature, proposes a potential disease mechanism (Figure 5): primary diseases lead to mitochondrial dysfunction in platelets and endothelial cells, resulting in elevated levels of miR-4485-5p within intracellular 13), 45)-48). This accompanies with the release of a substantial number of LEVs containing this miRNA into the bloodstream. The presence of miR-4485-5p contributes to the inhibition of tPA, a key component of the fibrinolytic system, in endothelial cells, thus creating a hypercoagulable environment conducive to the formation of DVT.
The study suggests that miR-4485-5p in LEVs could serve as a promising biomarker for DVT. Compared to traditional tests like the blood D-dimer test, miR-4485-5p in LEVs exhibited better specificity 9). Furthermore, it provides a more stable measurement than ultrasonography of the lower limbs, which can vary in diagnostic performance based on the examiner and equipment 9). The potential utility of measuring miR-4485-5p is seen in its ability to overcome the limitations of existing tests and improve the diagnosis of DVT.
Our study acknowledges several limitations. The small number of cases analyzed calls for further studies with a larger number of DVT cases. The prevalence of both cancer and DVT in most patients makes it challenging to determine the individual contributions of each disease to the results. The study also points out the need for further research to specify the origin of the identified miRNAs within LEVs and to elucidate detailed underlying mechanisms. In particular, since CD31 is highly expressed in both vascular endothelium and platelets, it is necessary to determine whether the LEVs are of vascular endothelial or platelet origin 34). Currently, there is no consensus on which cell type predominantly contributes to the high CD31 expression on LEVs. Furthermore, it is important to determine whether miR-4485-5p-rich LEVs are derived from vascular endothelium or platelets.
In conclusion, the study highlights the clinical significance of DVT diagnosis, especially considering that 10% of unidentified VTEs (uVTE) are diagnosed as cancer within a year 49). A substantial portion (more than 60%) of cancers of unknown primary origin is diagnosed shortly after the identification of uVTE 49). This suggests that latent DVT might be an early indicator of cancer. Recognizing the importance of early DVT diagnosis from a cancer perspective, the study emphasizes the need to establish biomarkers that can enhance the diagnostic performance of DVT. miR-4485-5p in LEVs is proposed as a potential biomarker that could fulfill this role.
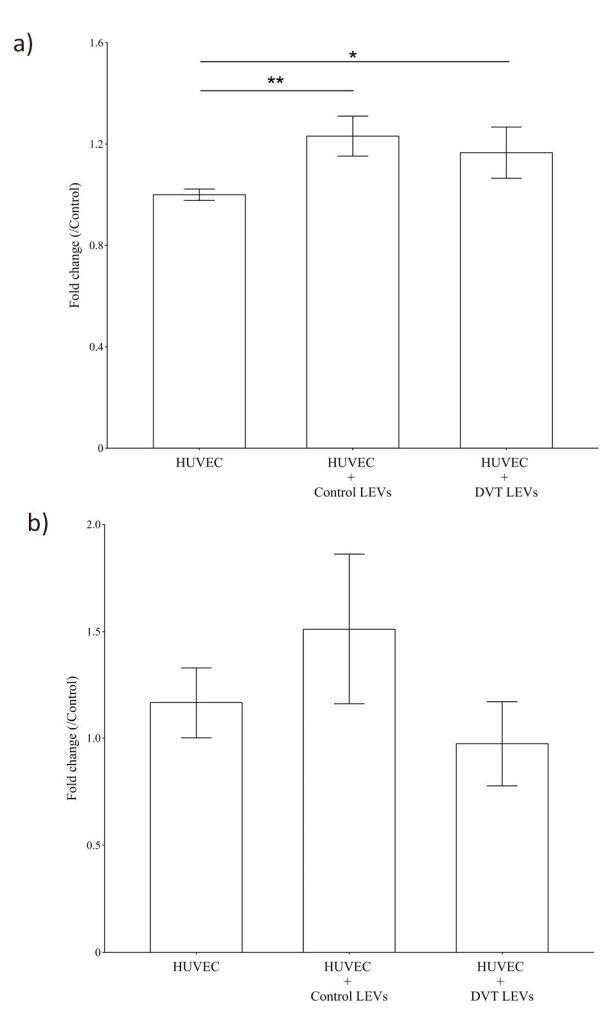
Figure 4 Increase of miR-4485-5p induced by LEVs.
(a) Expression level of miR-4485-5p and (b) PLAT in HUVEC with 100,000 control and DVT LEVs after 24 hours, as analyzed by RT-qPCR (n = 3) (* p < 0.05, ** p < 0.01).
Funding
This study was funded by the Japanese Society of Laboratory Medicine Fund for the Promotion of Scientific Research and JSPS KAKENHI Grant Number JP 19K16954 and JP 23K06930.
Acknowledgements
We thank Mr. Shinichi Mizuno for the management of personal information, Mr. Hiroshi Shigeto for the support of English editing and suggestions, Ms. Aya Higashi for assisting blood sample storage, and Ms. Kazue Akita for the clerical work.
Author Contributions
Conceptualization: HM, HS., Formal analysis: HS., Funding acquisition: HM, SS, TU, HS., Investigation: HS, SS, MR., Methodology: HM, TU, HS., Project administration: HM, KT., Resources: DS, MN, HU., Software: HS, MR., Supervision: HM, KT, TU., Validation: HS, SS, MR., Writing – original draft: HS, HM., Writing – review & editing: HM, HS, DS, KT.
Competing Interest
The authors have declared that no competing interests exist.
Reference
- Cushman M, Barnes GD, Creager MA, et al. American Heart Association Council on Peripheral Vascular Disease; Council on Arteriosclerosis, Thrombosis and Vascular Biology; Council on Cardiovascular and Stroke Nursing; Council on Clinical Cardiology; Council on Epidemiology and Prevention; and the International Society on Thrombosis and Haemostasis, Venous Thromboembolism Research Priorities: A Scientific Statement From the American Heart Association and the International Society on Thrombosis and Haemostasis. Circulation 2020; 142(6): e85-94. doi:10.1161/CIR.0000000000000818.
- Stone J, Hangge P, Albadawi H, et al. Deep vein thrombosis: pathogenesis, diagnosis, and medical management. Cardiovasc Diagn Ther 2017; 7(Suppl 3): S276-84. doi:10.21037/cdt.2017.09.01.PubMed
- Akinbo DB, Ajayi OI. Thrombotic Pathogenesis and Laboratory Diagnosis in Cancer Patients, An Update.Int J Gen Med 2023; 16: 259-72. doi: 10.2147/IJGM.S385772.PubMed
- Hisada Y, Mackman N. Cancer-associated pathways and biomarkers of venous thrombosis. Blood 2017; 130(13): 1499-506. doi: 10.1182/blood-2017-03-743211.PubMed
- Sakamoto J, Yamashita Y, Morimoto T, et al. cancer-associated venous thromboembolism in the real world – from the COMMAND VTE registry. Circ J 2019; 83(11): 2271-81. doi: 10.1253/circj. CJ-19-0515.PubMed
- Blom JW, Doggen CJM, Osanto S, et al. Malignancies, prothrombotic mutations, and the risk of venous thrombosis. JAMA 2005; 293(6): 715-22. PubMed
- Razak NBA, Jones G, Bhandari M, et al. Cancer-associated thrombosis: An overview of mechanisms, risk factors, and treatment. Cancers(Basel) 2018; 10(10): 380. doi: 10.3390/cancers10100380.PubMed
- Ferlay J, Colombet M, Soerjomataram I, et al. Cancer statistics for the year 2020: An overview. Int J Cancer 2021; 149: 778-89. doi: 10.1002/ijc.33588. PubMed
- Lim W, Gal GL, Bates SM, et al. American Society of Hematology 2018 guidelines for management of venous thromboembolism: diagnosis of venous thromboembolism. Blood Adv 2018; 2(22): 3226-56. doi: 10.1182/bloodadvances.2018024828.PubMed
- Kelly J, Rudd A, Lewis RR, et al. Plasma D-dimers in the diagnosis of venous thromboembolism. Arch Intern Med 2002; 162(7): 747-56. doi: 10.1001/archinte.162.7.747.PubMed
- Kwietniak M, AI-Amawi T, Błaszkowski T, et al. The usefulness of D-dimer in diagnosis and prediction of venous thromboembolism in patients with abdominal malignancy. Pol Przegl Chir 2017; 89(3): 27-30. doi: 10.5604/01.3001.0010.1018.PubMed
- Mooberry MJ, Key NS. Microparticle analysis in disorders of hemostasis and thrombosis. Cytometry A 2016; 89(2):111-22. https://doi: 10.1002/cyto.a.22647.PubMed
- Konkoth A, Saraswat R, Dubrou C, et al. Multifaceted role of extracellular vesicles in atherosclerosis. Atherosclerosis. 2021; 319: 121-31. doi: 10.1016/j.atherosclerosis.2020.11.006.PubMed
- Chirinos JA, Heresi GA, Velasquez H, et al. Elevation of endothelial microparticles, platelets, and leukocyte activation in patients with venous thromboembolism. J Am Coll Cardiol 2005; 45(9): 1467-71. doi: 10.1016/j.jacc.2004.12.075.PubMed
- Nazari M, Javandoost E, Talebi M, et al. Platelet microparticle controversial role in cancer. Adv Pharm Bull 2021; 11(1): 39-55. doi: 10.34172/apb.2021.005.PubMed
- Oyabu C, Morinobu A, Sugiyama D, et al. Plasma platelet-derived microparticles in patients with connective tissue diseases. J Rheumatol 2011; 38(4): 680-4. doi: 10.3899/jrheum.100780. PubMed
- Fink K, Moebes M, Vetter C, et al. Selenium prevents microparticle-induced endothelial inflammation in patients after cardiopulmonary resuscitation. Crit Care 2015; 19(1): 58. doi: 10.1186/s13054-015-0774-3.PubMed
- Nomura S. Microparticle and atherothrombotic diseases. J Atheroscler Thromb 2016; 23(1): 1-9. doi: 10.5551/jat.32326.PubMed
- Date K, Hall J, Greenman J, et al. Tumour and microparticle tissue factor expression and cancer thrombosis. Thromb Res 2013; 131(2):109-15. doi: 10.1016/j.thromres.2012.11.013. PubMed
- Almeida VH, Rondon AMR, Gomes T, et al. Novel Aspects of Extracellular Vesicles as Mediators of Cancer-Associated Thrombosis. Cells 2019; 13(8); 716. doi: 10.3390/cells8070716.PubMed
- O’Brien J, Hayder H, Zayed Y, et al. Overview of microRNA biogenesis, Mechanisms of Actions, and Circulation. Front Endocrinol(Lausanne) 2018; 9: 402. doi: 10.3389/fendo.2018.00402. PubMed
- Katoh M. Cardio-miRNAs and onco-miRNAs: circulating miRNA-based diagnostics for non-cancerous and cancerous diseases. Front Cell Dev Biol 2014; 2: 61. doi: 10.3389/fcell.2014.00061.PubMed
- Wang J, Chen J, Sen S. MicroRNA as Biomarkers and Diagnostics. J Cell Physiol. 2016; 231(1): 25-30. doi: 10.1002/jcp.25056.PubMed
- Jiang Z, Ma J, Wang Q, et al. Combination of circulating miRNA-320a/b and D-Dimer improves diagnostic accuracy in deep vein thrombosis patients. Med Sci Monit 2018; 24: 2031-7. doi: 10.12659/msm.906596.PubMed
- Kearon C, Akl EA, Ornelas J, et al. Antithrombotic Therapy for VTE Disease: CHEST Guideline and Expert Panel Report. Chest. 2016; 149(2): 315-52. doi: 10.1016/j.chest.2015.11.026. PubMed
- Théry C, Witwer KW, Aikawa E, et al. Minimal information for studies of extracellular vesicles 2018 (MISEV2018): a position statement of the International Society for Extracellular Vesicles and update of the MISEV2014 guidelines. J Extracell Vesicles. 2018; 7(1): 1535750. doi: 10.1080/20013078.2018.1535750.PubMed
- Chen JJ, Tsai CA, Tzeng S, et al. Gene selection with multiple ordering criteria. BMC Bioinformatics. 2007; 8: 74. doi: 10.1186/1471-2105-8-74.PubMed
- Rácz GA, Nagy N, Tóvári J, et al. Identification of new reference genes with stable expression patterns for gene expression studies using human cancer and normal cell lines. Sci Rep 2021; 11(1):19459. doi: 10.1038/s41598-021-98869-x.PubMed
- Zimmerman DW. A note on preliminary tests of equality of variances. Br J Math Stat Psychol 2004; 57(Pt 1): 173-81. doi: 10.1348/000711004849222.PubMed
- Fagerland MW, Sandvik L, Mowinckel P, et al. Parametric methods outperformed non-parametric methods in comparisons of discrete numerical variables. BMC Med Res Methodol 2011; 11: 44. doi: 10.1186/1471-2288-11-44.PubMed
- Robin X, Turck N, Hainard A, et al. pROC: an open-source package for R and S+ to analyze and compare ROC curves. BMC Bioinformatics 2011; 12: 77. doi: 10.1186/1471-2105-12-77.PubMed
- Lazar S, Goldfinger LE. Platelets and extracellular vesicles and their cross talk with cancer. Blood 2021; 137(23): 3192-200. doi: 10.1182/blood.2019004119.PubMed
- Snir O, Wilsgård L, Latysheva N, et al. Plasma levels of platelet-derived microvesicles are associated with risk of future venous thromboembolism. J Thromb Haemost 2022; 20(4): 899-908. doi: 10.1111/jth.15638.PubMed
- El-Gamal H, Parray AS, Mir FA, et al. Circulating microparticles as biomarkers of stroke: A focus on the value of endothelial -and platelet- derived microparticles. J Cell Physiol 2019; 234(10): 16739-54. doi: 10.1002/jcp.28499.PubMed
- Dweep H, Gretz N, Sticht C. miRWalk database for miRNA-target interactions. Methods Mol Biol 2014; 1182: 289-305. doi: 10.1007/978-1-4939-1062-5_25.PubMed
- Uhlen M, Ponten F. Antibody-based proteomics for human tissue profiling. Mol Cell Proteomics 2005; 4(4): 384-93. doi: 10.1074/mcp.R500009-MCP200.PubMed
- Wojta J, Hoover RL, Daniel TO. Vascular origin determines plasminogen activator expression in human endothelial cells. Renal endothelial cells produce large amounts of single chain urokinase type plasminogen activator. J Biol Chem 1989; 264(5): 2846-52. PMID: 2492525PubMed
- Diamond SL, Eskin SG, Mclntire LV. Fluid flow stimulates tissue plasminogen activator secretion by cultured human endothelial cells. Science 1989; 243(4897):1483-5. doi: 10.1126/science.2467379.PubMed
- Bianchessi V, Badi I, Bertolotti M, et al. The mitochondrial lncRNA ASncmtRNA-2 is induced in aging and replicative senescence in Endothelial Cells. J Mol Cell Cardiol 2015; 81: 62-70. doi: 10.1016/j.yjmcc.2015.01.012.PubMed
- Fitzpatrick C, Bendek MF, Briones M, et al. Mitochondrial ncRNA targeting induces cell cycle arrest and tumor growth inhibition of MDA-MB-231 breast cancer cells through reduction of key cell cycle progression factors. Cell Death Dis 2019; 10(6): 423. doi: 10.1038/s41419-019-1649-3.PubMed
- Burzio VA, Villota C, Villegas J, et al. Expression of a family of noncoding mitochondrial RNAs distinguishes normal from cancer cells. Proc Natl Acad Sci USA 2009; 106(23): 9430-4. doi: 10.1073/pnas.0903086106.PubMed
- Borgna V, Villegas J, Burzio VA, et al. Mitochondrial ASncmtRNA-1 and ASncmtRNA-2 as potent targets to inhibit tumor growth and metastasis in the RenCa murine renal adenocarcinoma model. Oncotarget 2017; 8(27): 43692-708. doi: 10.18632/oncotarget.18460.PubMed
- Farfán N, Sanhueza N, Briones M, et al. Antisense noncoding mitochondrial RNA-2 gives rise to miR-4485-3p by Dicer processing in vitro. Biol Res 2021; 54(1): 33. doi: 10.1186/s40659-021-00356-0.PubMed
- Burger D, Kwart DG, Montezano AC, et al. Microparticles induce cell cycle arrest through redox-sensitive processes in endothelial cells: implications in vascular senescence. J Am Heart Assoc 2012; 1(3): e001842. doi: 10.1161/JAHA.112.001842.PubMed
- Zhou B, Tian R. Mitochondrial dysfunction in pathophysiology of heart failure. J Clin Invest 2018; 128(9): 3716-26. doi: 10.1172/JCI120849. PubMed
- Thaler J, Koder S, Kornek G, et al. Microparticle-associated tissue factor activity in patients with metastatic pancreatic cancer and its effect on fibrin clot formation. Transl Res 2014; 163(2): 145-50. doi: 10.1016/j.trsl.2013.06.009.PubMed
- Branchford BR, Carpenter SL. The Role of inflammation in venous thromboembolism. Front Pediatr 2018; 6: 142. doi: 10.3389/fped.2018.00142. PubMed
- Signorelli SS, Conti GO, Fiore M, et al. Platelet-derived microparticles (MPs) and thrombin generation velocity in deep vein thrombosis (DVT): Results of a case-control study. Vasc Health Risk Manag 2020; 16: 489-95. doi: 10.2147/VHRM.S236286.PubMed
- Carrier M, Langner AL, Shivakumar S, et al. SOME Investigators, Screening for occult cancer in unprovoked venous thromboembolism. N Engl J Med 2015; 373(8): 697-704. doi: 10.1056/NEJMoa1506623.