†Shingo Tanaka*1,2,3, Noboru Ohba*2, Kiyoshi Abe*2, Yuka Tamoto*2, Kenji Yasui*2, Chihiro Kobayashi*2, Nagomi Saito*2, Koji Miyanishi*3, Satoshi Takahashi*1,2, Junji Kato*3
Tanaka S, Ohba N, Abe K, Tamoto Y, Yasui K, Kobayashi C, Saito N, Miyanishi K, Takahashi S, Kato J. The coefficient of determination is affected by the attenuation coefficient in attenuation imaging. Lab Med Int 2023; 2(3): 42-49. doi: 10.51041/lmi.2.3_42
Original
Lab Med Int 2023; 2(3): 42-49
†Correspondence: Department of Infection Control and Laboratory Medicine, and Department of Medical Oncology, Sapporo Medical University School of Medicine, South-1, West-16, Sapporo 060-8543, Japan.
E-mail: stanaka”@”sapmed.ac.jp
Received December 25, 2022; accepted December 26, 2023
*1 Department of Infection Control and Laboratory Medicine, Sapporo Medical University School of Medicine, Sapporo, Japan.
*2 Division of Laboratory Medicine, Sapporo Medical University Hospital, Sapporo, Japan.
*3 Department of Medical Oncology, Sapporo Medical University School of Medicine, Sapporo, Japan.
ABSTRACT
Aims: Attenuation imaging (ATI) is a new ultrasonography method of evaluating hepatic steatosis. Attenuation coefficients (ACs) in the region of interest are measured using two-dimensional ultrasonography. ATI also displays the coefficient of determination (R2) as an index of AC reliability. This study aimed to elucidate R2 values in patients who underwent ATI in clinical practice and to determine factors that influence R2 values.
Methods: This study included 749 patients who underwent ATI to evaluate hepatic steatosis at a single center. All abdominal ultrasound examinations were performed by one of the five experienced ultrasonographers. The AC and R2 values were measured five times, and the median values were calculated. Multivariate analysis was conducted to identify factors affecting R2 values.
Results: One hundred and nine (15%) patients showed R2 values of < 0.80, of which 108 had non-fatty liver. Further, the R2 value was strongly correlated with AC (correlation coefficient = 0.842). Uncomplicated diabetes (Odds ratio [OR], 2.68) and AC (< 0.60 dB/cm/MHz; OR, 72.76) were identified as independent factors associated with low R2 values (< 0.80).
Conclusion: ATI in patients with non-fatty liver showed low R2 values. Worldwide standardization of the ATI measurement method is urgently needed for consistent results.
〔Lab Med Int 2023; 2(3): 42-49〕
Key Words
abdominal ultrasonography, attenuation imaging, coefficient of determination, fatty liver, non-alcoholic fatty liver disease(NAFLD)
I. Introduction
Hepatic steatosis is a characteristic feature of non-alcoholic fatty liver disease (NAFLD), the most common cause of chronic liver disease (CLD) worldwide 1). Hence, clinical evaluation of steatosis is important for the management of patients with CLD. Further, steatosis can also progress to non-alcoholic steatohepatitis (NASH) and clinically significant fibrosis in patients with NAFLD 2).
Abdominal ultrasonography (US) is the primary strategy for the diagnosis and assessment of fatty liver 3); however, conventional B-mode US is operator dependent, and the diagnostic accuracy decreases in cases of mild steatosis 4). To overcome these limitations, new methods for quantifying the transmitted US beam attenuation within the liver parenchyma have been developed 5). The controlled attenuation parameter (CAP) of FibroScan, the first US-based tool available for the quantification of hepatic steatosis, has been used in clinical practice with promising results 6)7), although it is not an imaging modality and is associated with a high rate of measurement failure (0–24%) 8).
Attenuation imaging (ATI) is a new ultrasound-based method for the assessment of hepatic steatosis 9), which allows for positioning of the region of interest (ROI) for attenuation coefficient (AC) measurement using two-dimensional (2D) US imaging. ATI also displays the coefficient of determination (R2) as an index of the AC reliability, and the measurements with an R2 values of < 0.70 are recommended to be ineligible by the manufacturer. In clinical trials using ATI, the eligibility criteria often included an R2value of ≥ 0.80, which is met by most cases 10)-13). However, in clinical practice, an R2 value of < 0.80 is often observed, with no consensus on the factors that affect R2 value. Therefore, this study aimed to the R2 value of patients who underwent ATI in clinical practice and investigates the factors influencing R2 values. Our results will provide deeper insights into the link between R2 values and liver-associated pathologies.
II. Materials and Methods
Study population
This retrospective cohort study analyzed the data of patients who underwent ATI for the evaluation of hepatic steatosis at our Hospital between June 2021 and November 2021. The inclusion criteria were: 1)≥ 16 years of age; 2) no acute hepatitis, drug-induced liver injury, infectious diseases, nephrosis, or cancer; 3) no pregnancy; and 4) no anatomically difficult cases for ATI, such as right lobectomy, multiple liver cysts, and pneumobilia.
This study was approved by our university Institutional Review Board (ID: 332-186). Informed consents were obtained using an opt-out option on our website, and the patients who did not provide informed consents were excluded. This study was conducted in accordance with the principles of the Declaration of Helsinki.
Clinical and laboratory data
Baseline parameters of each patient such as age, sex, height, weight, and daily alcohol consumption were recorded on the day of ATI examination. The NAFLD criteria of alcohol consumption were defined as ethanol intake of < 210 and < 140 g per week for males and females, respectively 14). In all cases, the serum levels of aspartate aminotransferase (AST), alanine aminotransferase (ALT), and albumin, and the platelet count (PLT) were measured using standard biochemical methods within 1 month of ATI examination at our hospital laboratory. Patients were identified as having diabetes if they were receiving oral hypoglycemic drug or insulin treatment for diabetes, or had hemoglobin A1c (HbA1c) ≥ 6.5% or fasting blood glucose ≥ 126 mg/dL or random blood glucose ≥ 200 mg/dL 15).
Abdominal ultrasound examination
All abdominal US examinations were conducted by one of the five ultrasonographers (N.O., K.A., Y.T., C.K., and N.S., all with more than seven years of experience) using a US scanner (Aplio i700; Canon Medical System, Otawara, Japan) with a 1-to-8-MHz convex probe (PVI-475BX). All patients were fasted for at least 6 h before the examination, which was performed in the supine position with the right arm extended above the head. In B-mode examination, either the bright liver or hepato-renal echo contrast were used as the diagnostic criteria for fatty liver 16). All 2D shear-wave elastography (SWE) examinations were conducted in the right liver lobe through the intercostal space. The SWE measurement methods were as per previous reports 17).
ATI examination
After B-mode examination, ATI examination was performed in the right liver lobe through the intercostal window. A fan-shaped sample box was placed on the right liver lobe parenchyma, and a 2 × 3 cm measurement ROI (m-ROI) was placed as previously described 18). In brief, an m-ROI was placed around the center of the image, avoiding vessels and shadowing. The top edge of the m-ROI was set at twice the depth of the liver capsule to avoid artifacts.
The AC value (dB/cm/MHz) appeared immediately after the placement of m-ROIs at the bottom of the image. In addition, the goodness of fit of the line profile was displayed as an R2 value next to the AC, which indicated the reliability of the results. The R2 values were categorized into poor (R2 < 0.70), good (0.70 ≤ R2 <0.90), and excellent (R2≥ 0.90) by the manufacturer, which were displayed in red, yellow, and white, respectively. The AC measurements with R2 values of ≥ 0.70 were considered valid in this study, and the median values were calculated from five different measurements. The principle and detailed measurement protocol of ATI were presented in a previous review 9).
Statistical analysis
Continuous variables are expressed as medians and ranges. Groups were compared using the Chi-square and Kruskal-Wallis tests for the categorical and quantitative data, respectively. The Spearman rank correlation was used to quantify the association among continuous variables. Further, logistic regression analysis was used to identify significant risk factors for low R2 values (< 0.80). Based on previous reports 10)-13), 18)-21), in the statistical analysis of this study, an AC of < 0.60 is diagnosed as the non-fatty liver. All statistical tests were two-sided, and P < 0.05 was considered statistically significant. All statistical analyses were performed using JMP Pro 15.2.1 (SAS, Cary, NC, USA).
III. Results
Patient characteristics
A total of 750 patients were initially included in this study; one patient with hepatitis B virus (HBV)-related cirrhosis was excluded due to low R2 value (< 0.70). Table 1 lists the baseline clinical characteristics of the study patients. A total of 190 patients (25%) were obese (BMI ≥25 kg/m2). Further, 674 patients (90%) displayed alcohol consumption that met the NAFLD criteria. Diabetes was complicated in 154 (21%) cases.
Ultrasound findings
The median subcutaneous thickness and shear-wave speed were 16.2 mm and 1.30 m/sec, respectively (Table 2). The median AC was 0.58 dB/cm/MHz, and the AC value represented a graph that spread to both sides of the scale with the peak at 0.55 to 0.59 dB/cm/MHz (Figure 1A). The diagnostic rate of fatty liver was 34% and 41% for B-mode findings (bright liver or/and hepato-renal echo contrast) and ATI (AC ≥ 0.60 dB/cm/MHz), respectively. The median R2 value was 0.87; R2 values of ≥ 0.90, 0.80 to 0.89, and 0.70 to 0.79 were observed in 290 (39%), 350 (47%), and 109 (15%) patients, respectively (Figure 1B).
Effects of the inter-ultrasonographer comparisons
The measurements of AC and R2 values were compared with the ultrasonographers. A significant difference was observed in the prevalence of diabetes (P = 0.003) and shear-wave speed (P < 0.001) in the baseline characteristics of the patients (Table 3). However, no significant differences were observed in the measurements of the AC and R2 values among ultrasonographers (Figure 2A, B).
Correlations between clinical findings and the coefficient of determination (R2)
AC was identified as the most highly correlated factor (correlation coefficient [r] = 0.842) with R2 values. Of the 109 cases with R2 values of < 0.80, 108 patients showed an AC of < 0.60 (Figure 3). Furthermore, BMI (r = 0.521) and skin-liver capsule distance (r = 0.525) also showed relatively strong correlations (Table 4).
Determinant factors for the low coefficient of determination (R2)
Univariate analysis identified the female sex (Odds ratio [OR] 1.64, P = 0.024), BMI < 23 kg/m2 (OR 3.86, P < 0.001), uncomplicated diabetes (OR 3.25, P = 0.001), ALT < 30 IU/L (OR 2.38, P = 0.005), albumin < 4.0 g/dL (OR 1.53, P = 0.045), skin-liver capsule distance < 20 mm (OR 6.15, P < 0.001), and AC < 0.60 dB/cm/MHz (OR 98.95, P < 0.001) as factors significantly associated with low R2 values (< 0.80) (Table 5). However, in multivariate analysis, uncomplicated diabetes (OR 2.68, P = 0.010) and AC < 0.60 dB/cm/MHz (OR 72.76, P < 0.001) were the only independent determinant factors for low R2 values.
Discussion
The coefficient of determination (R2) is an important value as it indicates AC reliability during ATI. However, in clinical practice, the R2 value and its influencing factors remain uninvestigated. This study showed that the patients with R2 values of < 0.80 had non-fatty liver, suggesting that the high R2 values observed in clinical trials were possibly related to the recruitment of a high number of patients with fatty liver disease 10)-13). Since lower R2 values were associated with presence of more vessels in the m-ROI, higher R2 values of fatty livers may indicate obscurement of the vessels. In this study, we also showed a strong correlation of the R2 value with AC (Table 4). Further, uncomplicated diabetes and AC (< 0.60 dB/cm/MHz) were identified as factors that affect R2 values (Table 5).
The mechanism underlying high R2 values in diabetic patients remains unknown. Previous studies have shown a link between diabetes and CAP; a large cohort study revealed that in addition to information on the hepatic steatosis, CAP could reflect the severity of the metabolic syndrome 6). Additionally, in a separate study that utilized linear mixed model meta-analysis data, diabetes was shown to be related to CAP value independent of liver steatosis 7). Although the underlying mechanism of the relationship between CAP and diabetes have not been elucidated, epidemiological evidence exists 6)7). Further studies are warranted to better understand the mechanism by which diabetes affects the US beam attenuation and R2 values.
This study showed a difference between the examiners in SWE (Table 3). However, no inter-observer differences were observed for AC and R2 value measurements (Figure 2A, B). These results were consistent with those of previous study, wherein good (intraclass correlation coefficient [ICC] 0.792)22) or excellent (ICC 0.92)19) inter-observer reproducibility has been reported. Although this study is not an analysis of the same subjects, but only a comparison of median values in a large number of cases, we believe that inter-observer variability (for measuring AC and R2 values) can be eliminated if the measurement methods are standardized within the facility.
Until recently, liver biopsy was the reference standard for the fatty liver diagnosis and remains the only method for confirming a diagnosis of NASH 3). However, liver biopsy has several important limitations, including complications such as bleeding, small sample volume, sampling error, and variability of assessment among different pathologists 23). These limitations restrict the repetition of liver biopsies to observe histologic changes; therefore, a more accurate non-invasive technique is desired for grading steatosis.
MRI-estimated proton density fat fraction (PDFF) is a quantitative imaging technique that enables accurate, repeatable, and reproducible quantitative assessment of liver steatosis of the whole liver 24). The assessment of liver fat using MRI-PDFF has the highest diagnostic accuracy in comparison with any other non-invasive assessment method 5). Therefore, MRI-PDFF is the accepted reference standard for the evaluation of liver steatosis 24). Despite its strengths, MRI-PDFF is impractical due to associated high costs and unavailability.
In contrast, US-based techniques are advantageous due to their low cost of operation and easy and wide availability. In this context, ATI seems an attractive tool. Kuroda et al. reported that the areas under the receiver operating characteristic (AUROC) curve of ATI for identifying steatosis grade ≥ S1, ≥ S2, and S3 were 0.876, 0.883, and 0.908, respectively, which were significantly better than the results obtained with CAP for identifying S3 (AUROC 0.842, P = 0.028)20). In addition, the success rates of ATI and CAP were 100% (111/111) and 94.6% (105/111), respectively 20).
Data from previous clinical trials using ATI indicate that the most important obstacle for ATI is the non-standardized measurement method. The size and location of the m-ROI as well as the valid cut-off R2 values varied in previous studies 9). In the present study, the top edge of the m-ROI was set at twice the depth of the liver capsule. The usefulness of this m-ROI position has recently been reported21) but was not universally applicable. Even in this study, the ratio of the distance from the skin to the liver capsule and from the liver capsule to the upper end of the m-ROI was 0.87, slightly longer for the capsule–m-ROI (Table 2). This is probably due to multiple reflections in some patients with short subcutaneous thickness, leading to setting of the m-ROI deeper than twice.
Being a single-center study was the main limitation of this study as the results could not be generalized. Hence, to validate the results of this pilot study, prospective multicenter studies with a large number of patients are required. All the study participants were Japanese, and since ethnicities correlate with several disease conditions, further studies with patients of various ethnic groups are required to validate the results of this study in other ethnic populations.
In conclusion, this study showed that the R2 values, which represent AC reliability during diagnostic ATI for hepatic steatosis, of < 0.80 were associated with non-fatty liver. Further, AC and diabetes were identified as independent factors associated with low R2 values. ATI represents a technique with the scope of widespread diagnostic applications. However, the ATI method should be standardized, and further studies are needed to better understand the mechanism underlying the effects of diabetes on R2 values.
Table 1 Baseline clinical characteristics of the patients
(n = 749)
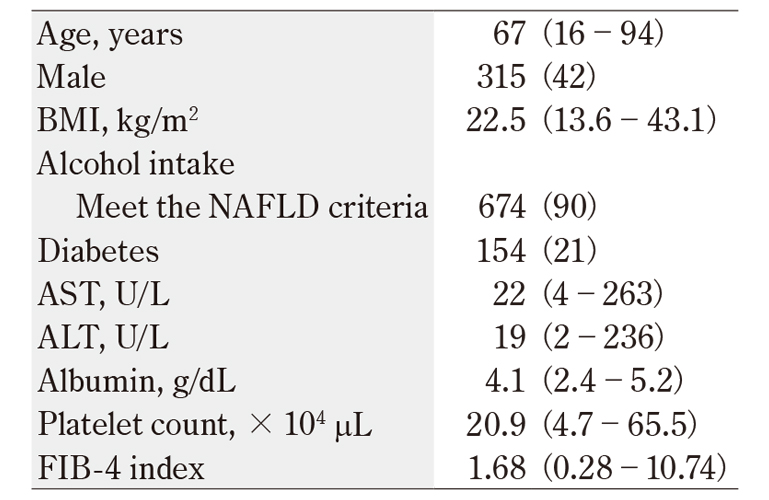
・ Note: Data are shown as n(%), or median(range).
・ Abbreviations: BMI, body mass index; NAFLD, non-alcoholic fatty liver disease; AST, aspartate transaminase; ALT, alanine transaminase.
・FIB-4 index =(AST×Age) /(Platelet count× √ALT)
Table 2 Ultrasound results in this study (n = 749)
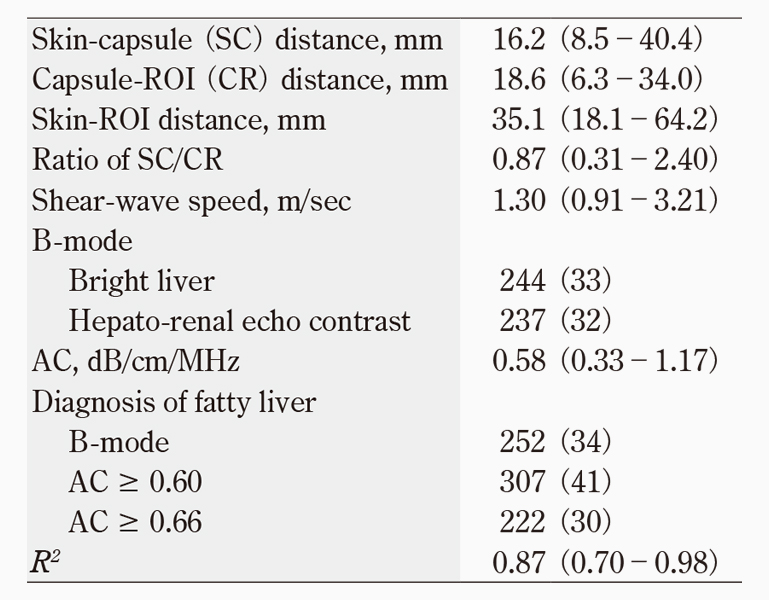
・ Note: Data are shown as n(%), or median(range). Abbreviations: ROI, region of interest; AC, Attenuation coefficient; R2, coefficient of determination.
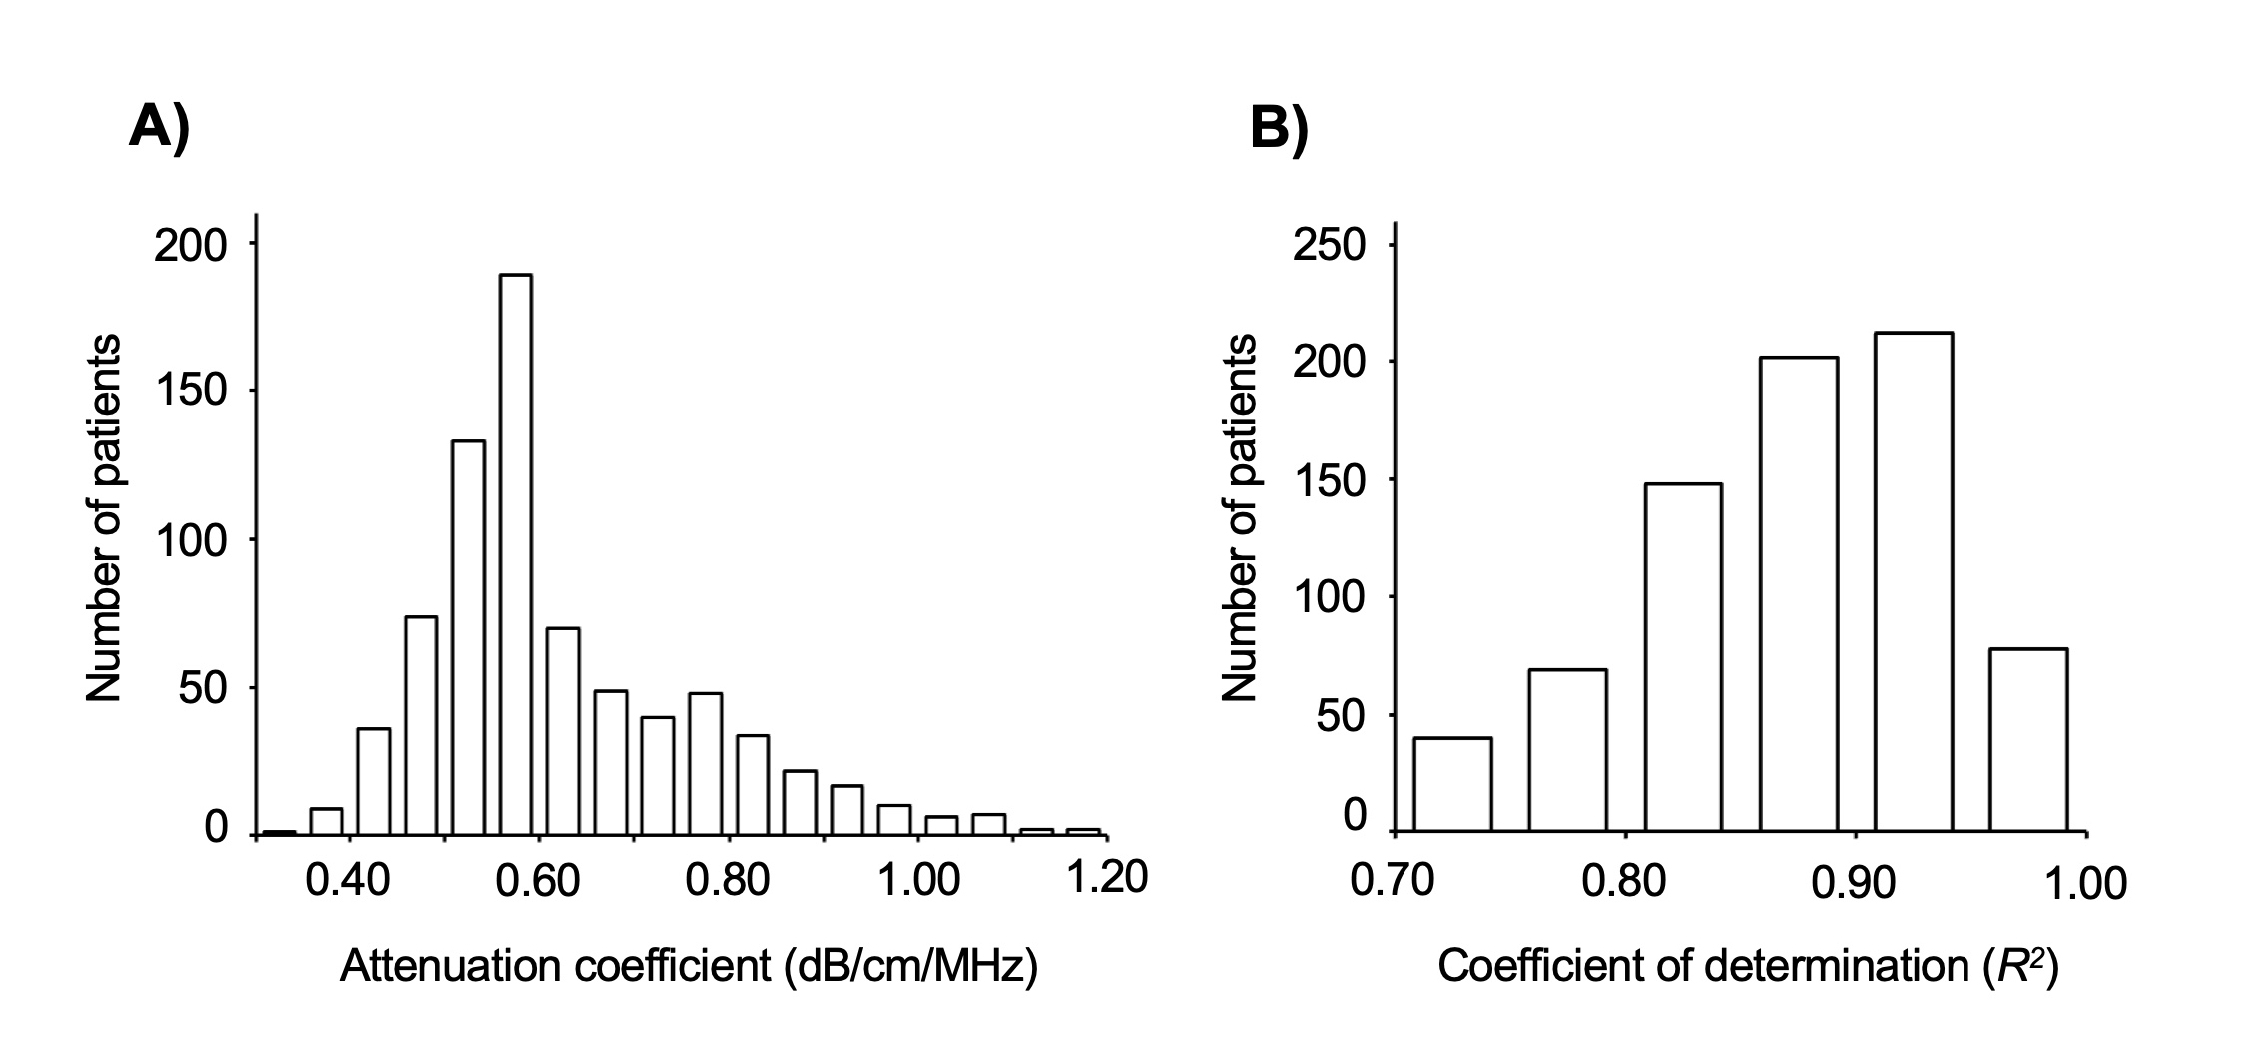
Figure 1 Bar chart for attenuation coefficient (AC) and coefficient of determination (R2) measurement results (n = 749). (A) The median AC was 0.58 dB/cm/MHz; the AC value spreads to both sides of the axis with the peak at 0.55 to 0.59 dB/ cm/MHz. (B) The median R2 value was 0.87, with 109 cases (15%) having R2 value range of 0.70 to 0.79.
Table 3 Patient and ultrasound results by the ultrasonographers (n = 749)
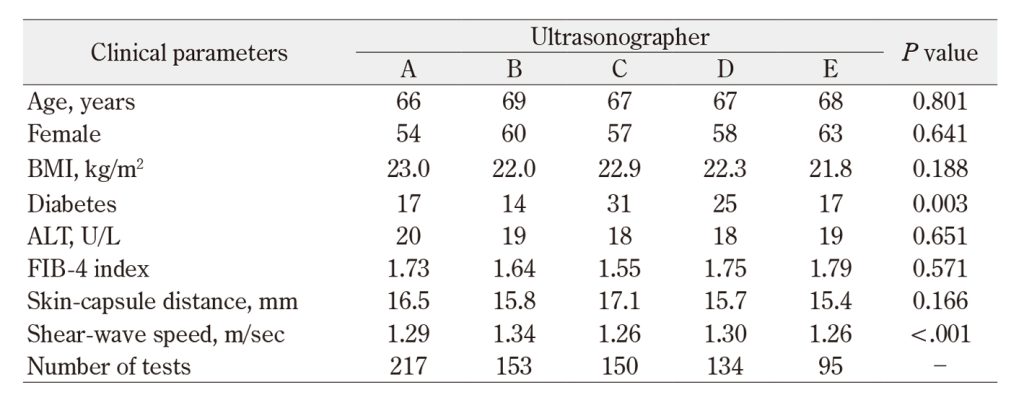
・ Note: Data are shown as n (%), or median (range).
・ Abbreviations: BMI, body mass index; ALT, alanine transaminase; AC, Attenuation coefficient.
・ FIB-4 index = (AST×Age) / (Platelet count×√ALT)
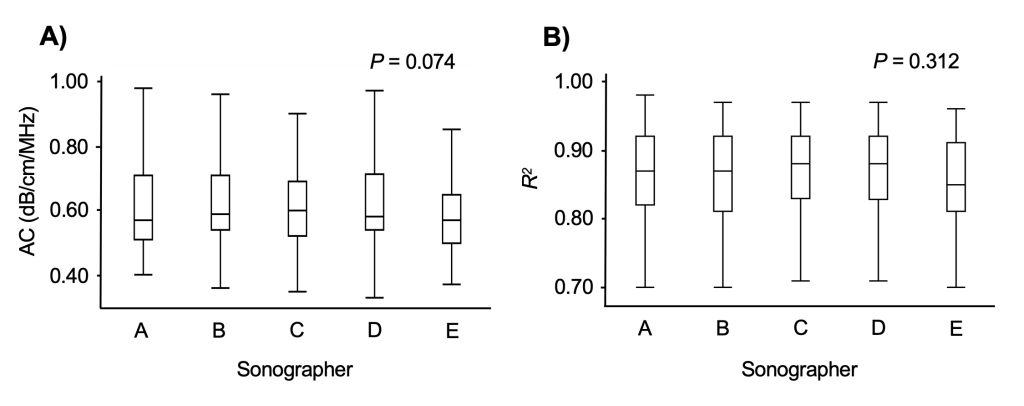
Figure 2 Comparison of attenuation coefficient (AC) and coefficient of determination (R2) based on the ultrasonographers (n = 749).
(A) AC and (B) R2 values show the comparison based on ultrasonographers; the number of tests conducted was: ultrasonographer A (n = 217); B (n = 153); C (n = 150); D (n = 134); E (n = 95). The results are shown as box plot profiles, with the bottom and top edges of the boxes representing the 25th and 75th percentiles, respectively. Median values are shown by the line within the box.
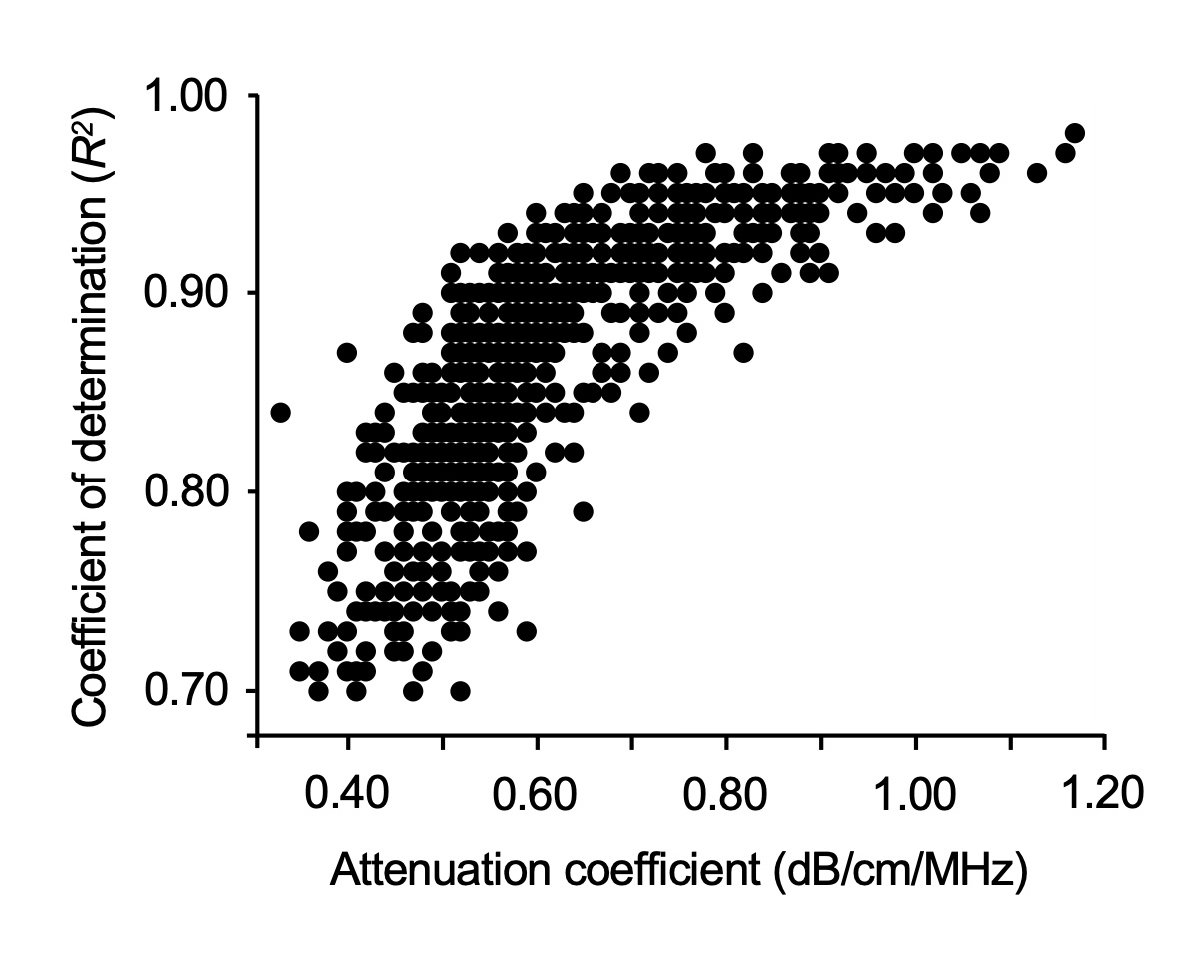
Figure 3 Scatter plots for attenuation coefficient(AC) and coefficient of determination(R2)(n = 749).
The AC and R2 were strongly correlated(correlation coefficient = 0.842), and of the 109 cases with R2 < 0.80, 108 cases had AC of < 0.60.
Table 4 Correlations between clinical findings and coefficient of determination(R2)(n = 749)
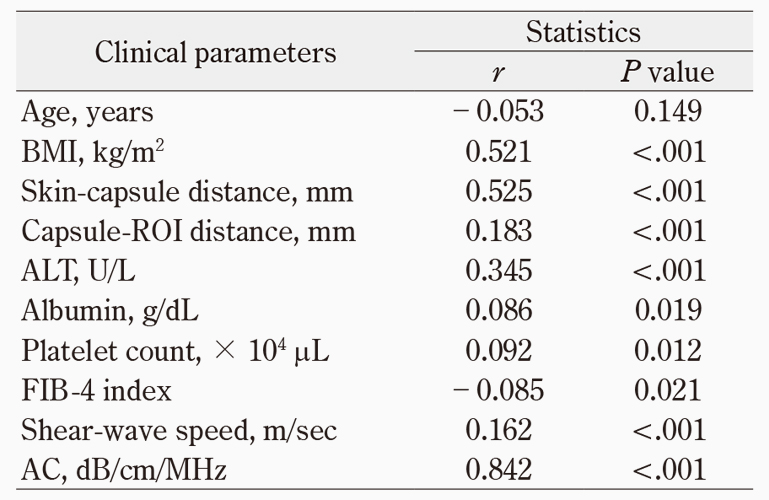
・ Abbreviations: r, correlation coefficient; BMI, body mass index; ROI, region of interest; ALT, alanine transaminase; AC, Attenuation coefficient.
・ FIB-4 index =(AST×Age) /(Platelet count×√ALT)
Table 5 Multivariate analysis of factors associated with low value of coefficient of determination (R2 < 0.80)
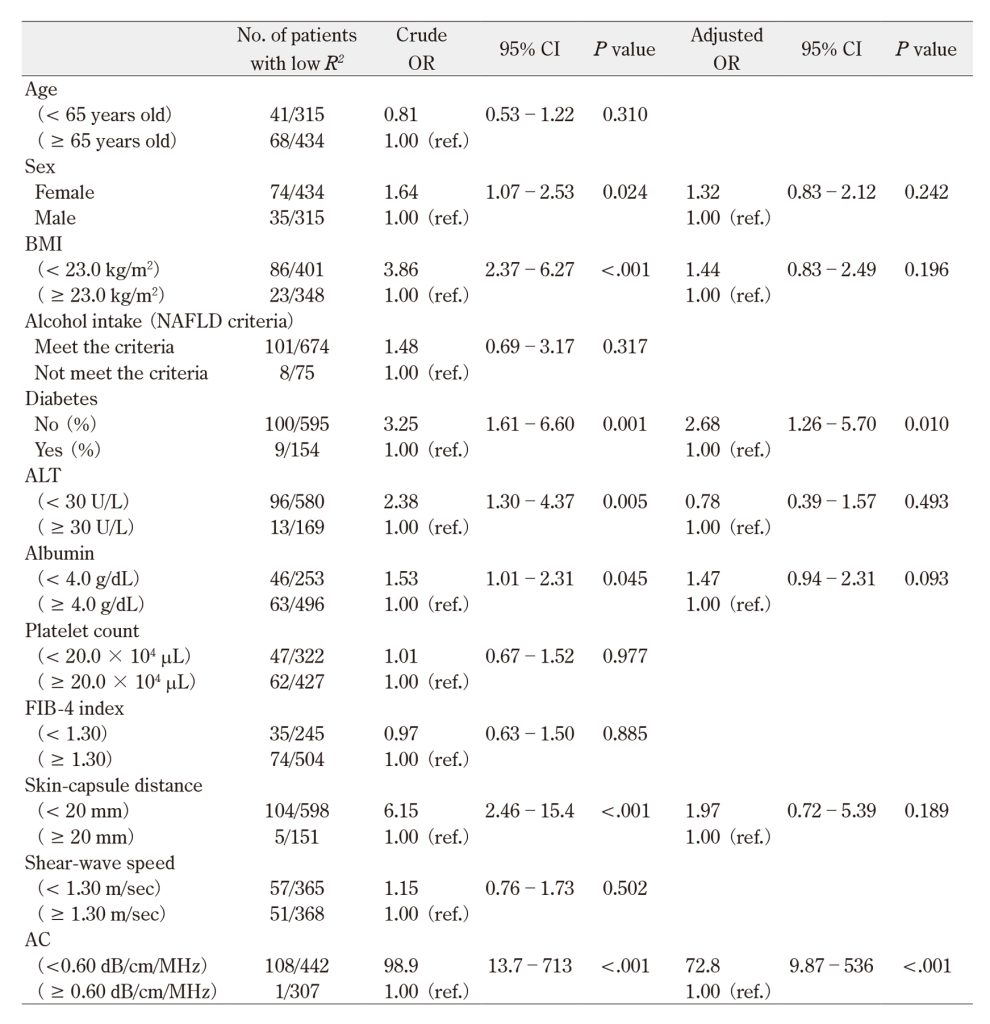
・ Abbreviations: OR, odds ratio; CI, confidence interval; BMI, body mass index; NAFLD, non-alcoholic fatty liver disease; ALT, alanine transaminase; AC, Attenuation coefficient; ref., reference.
・ FIB-4 index =(AST×Age) /(Platelet count×√ALT)
IV. Authorship Contributions
All authors made substantial contributions to the conception and design of the study. N.O., K.A., Y.T., C.K., and N.S. acquired the data. S.Tanaka analyzed and interpreted the data. S.Tanaka was the chief investigator and was responsible for the data analysis. N.O., K.A., K.Y. and K.M. provided logistical support and discussed the data. S.Takahashi and J.K. directed the overall project. All authors contributed to the writing of the final manuscript and provided final approval of the submitted version.
Acknowledgement
The authors would like to thank Editage (www.editage.com) for English language editing.
Conflict of interest statements
The authors declare that they have no conflict of interest associated with this study.
Funding sources
None.
References
- Huang DQ, El-Serag HB, Loomba R. Global epidemiology of NAFLD-related HCC: Trends, predictions, risk factors and prevention. Nat Rev Gastroenterol Hepatol 2021; 18(4): 223-38. doi: 10.1038/s41575-020-00381-6.PubMed
- McPherson S, Hardy T, Henderson E, et al. Evidence of NAFLD progression from steatosis to fibrosing-steatohepatitis using paired biopsies: Implications for prognosis and clinical management. J Hepatol 2015; 62(5): 1148-55. doi: 10.1016/j. jhep.2014.11.034.PubMed
- Tokushige K, Ikejima K, Ono M, et al. Evidence-based clinical practice guidelines for nonalcoholic fatty liver disease/nonalcoholic steatohepatitis 2020. Hepatol Res 2021; 51(10): 1013-25. doi: 10.1111/hepr.13688.PubMed
- Hernaez R, Lazo M, Bonekamp S, et al. Diagnostic accuracy and reliability of ultrasonography for the detection of fatty liver: A meta-analysis. Hepatology 2011; 54(3): 1082-90. doi: 10.1002/hep.24452.PubMed
- Tamaki N, Ajmera V, Loomba R. Non-invasive methods for imaging hepatic steatosis and their clinical importance in NAFLD. Nat Rev Endocrinol 2022; 18(1): 55-66. doi: 10.1038/s41574-021-00584-0.PubMed
- Lédinghen V de , Vergniol J, Capdepont M, et al. Controlled attenuation parameter(CAP) for the diagnosis of steatosis: A prospective study of 5323 examinations. J Hepatol 2014; 60(5): 1026-31. doi: 10.1016/j.jhep.2013.12.018.PubMed
- Karlas T, Petroff D, Sasso M, et al. Individual patient data meta-analysis of controlled attenuation parameter(CAP) technology for assessing steatosis. J Hepatol 2017; 66(5): 1022-30. doi: 10.1016/j.jhep.2016.12.022.PubMed
- Castera L, Friedrich-Rust M, Loomba R. Noninvasive assessment of liver disease in patients with nonalcoholic fatty liver disease. Gastroenterology 2019; 156(5): 1264-81. doi: 10.1053/j.gastro.2018.12.036.PubMed
- Lee DH. Quantitative assessment of fatty liver using ultrasound attenuation imaging. J Med Ultrason(2001) 2021; 48(4): 465-70. doi: 10.1007/s10396-021-01132-z.PubMed
- Bae JS, Lee DH, Lee JY, et al. Assessment of hepatic steatosis by using attenuation imaging: A quantitative, easy-to-perform ultrasound technique. Eur Radiol 2019; 29(12): 6499–507. doi: 10.1007/s00330-019-06272-y.PubMed
- Jeon SK, Lee JM, Joo I, et al. Prospective evaluation of hepatic steatosis using ultrasound attenuation imaging in patients with chronic liver disease with magnetic resonance imaging proton density fat fraction as the reference standard. Ultrasound Med Biol 2019; 45(6): 1407-16. doi: 10.1016/j.ultrasmedbio.2019.02.008.PubMed
- Burgio DM, Ronot M, Reizine E, et al. Quantification of hepatic steatosis with ultrasound: Promising role of attenuation imaging coefficient in a biopsy-proven cohort. Eur Radiol 2020; 30(4): 2293-301. doi: 10.1007/s00330-019-06480-6.PubMed
- Sugimoto K, Moriyasu F, Oshiro H, et al. The role of multiparametric US of the liver for the evaluation of nonalcoholic steatohepatitis. Radiology 2020; 296(3): 532-40. doi: 10.1148/radiol.2020192665.PubMed
- Chalasani N, Younossi Z, Lavine JE, et al. The diagnosis and management of nonalcoholic fatty liver disease: Practice guidance from the American association for the study of liver diseases. Hepatology 2018; 67(1): 328-57. doi: 10.1002/hep.29367.PubMed
- Cosentino F, Grant PJ, Aboyans V, et al. 2019 ESC Guidelines on diabetes, pre-diabetes, and cardiovascular diseases developed in collaboration with the EASD. Eur Heart J 2019; 41(2): 255-323. doi: 10.1093/eurheartj/ehz486.PubMed
- Hamaguchi M, Kojima T, Itoh Y, et al. The severity of ultrasonographic findings in nonalcoholic fatty liver disease reflects the metabolic syndrome and visceral fat accumulation. Am J Gastroenterol 2007; 102(12): 2708–15. doi: 10.1111/j.1572-0241.2007.01526.x.PubMed
- Ferraioli G, Wong VW-S, Castera L, et al. Liver ultrasound elastography: An update to the world federation for ultrasound in medicine and biology guidelines and recommendations. Ultrasound Med Biol 2018; 44(12): 2419–40. doi: 10.1016/j.ultrasmedbio.2018.07.008.PubMed
- Tada T, Iijima H, Kobayashi N, et al. Usefulness of attenuation imaging with an ultrasound scanner for the evaluation of hepatic steatosis. Ultrasound Med Biol 2019; 45(10): 2679-87. doi: 10.1016/j.ultrasmedbio.2019.05.033.PubMed
- Jesper D, Klett D, Schellhaas B, et al. Ultrasound-based attenuation imaging for the inter-observer variability. IEEE J Transl Eng Health Med 2020; 8: 1-9. doi: 10.1109/JTEHM.2020.3001488.PubMed
- Kuroda H, Abe T, Fujiwara Y, et al. Diagnostic accuracy of ultrasound-guided attenuation parameter as a noninvasive test for steatosis in non-alcoholic fatty liver disease. J Med Ultrason(2001) 2021; 48(4): 471-80. doi: 10.1007/s10396-021-01123-0.PubMed
- Sugimoto K, Abe M, Oshiro H, et al. The most appropriate region-of-interest position for attenuation coefficient measurement in the evaluation of liver steatosis. J Med Ultrason(2001) 2021; 48(4): 615–21. doi: 10.1007/s10396-021-01124-z.PubMed
- Yoo J, Lee JM, Joo I, et al. Reproducibility of ultrasound attenuation imaging for noninvasive evaluation of hepatic steatosis. Ultrasonography 2020; 39(2): 121-9. doi: 10.14366/usg.19034.PubMed
- Davison BA, Harrison SA, Cotter G, et al. Suboptimal reliability of liver biopsy evaluation has implications for randomized clinical trials. J Hepatol 2020; 73(6): 1322-32. doi: 10.1016/j.jhep.2020.06.025.PubMed
- Caussy C, Reeder SB, Sirlin CB, et al. Noninvasive, quantitative assessment of liver fat by MRI-PDFF as an endpoint in NASH trials. Hepatology 2018; 68(2): 763-72. doi: 10.1002/hep.29797.PubMed