Maiko Osaka*1, †Tomonori Kishino*1,2,3, Tsuyoshi Urata*1, Yoko Ida*1, Hideaki Mori*4, Naohiro Kawamura*4, Toshiaki Tanaka*5, Shohei Shibasaki*6, Masayuki Yotsukura*3, Takashi Watanabe*7, Hiroaki Ohnishi*1,2
†Correspondence: Department of Clinical Engineering, Kyorin University Faculty of Health Sciences, 5-4-1 Shimorenjaku, Mitaka, Tokyo 181-8612, Japan.
E-mail: kishino”@”ks.kyorin-u.ac.jp
Received November 17, 2022; accepted March 30, 2023
*1 Department of Clinical Laboratory, Kyorin University Hospital
*2 Department of Laboratory Medicine, Kyorin University School of Medicine
*3 Department of Clinical Engineering, Kyorin University Faculty of Health Sciences
*4 Department of Gastroenterology and Hepatology, Kyorin University School of Medicine
*5 Department of Diabetes, Endocrinology and Metabolism, Kyorin University School of Medicine
*6 Department of Medical Technology, Kyorin University Faculty of Health Sciences
*7 President, Kyorin University
Cite
Osaka M, Kishino T, Urata T, Ida Y, Mori H, Kawamura N, Tanaka T, Shibasaki S, Yotsukura M, Watanabe T, Ohnishi H. Findings on conventional sonography to predict the presence of liver injury in elderly women with non-alcoholic fatty liver disease. Lab Med Int 2023; 2(2): 30-38. doi: 10.51041/lmi.2.2_30
Original
Lab Med Int 2023; 2(2): 30-38
ABSTRACT
Introduction: Patients with non-alcoholic fatty liver disease (NAFLD) often demonstrate liver injury, as reflected by an elevated serum level of alanine aminotransferase (ALT). This study examined whether the presence of liver injury could be predicted based on findings from conventional sonography.
Methods: Subjects were 81 adult female NAFLD patients (mean age, 62±14 years). Defining liver injury as ALT levels >30 IU/L, sonographic findings were compared between patients with and without liver injury. In turn, ALT levels and liver size (defined as the sum of the length of the right lobe [R1+R2] and left lobe [L1+L2] were compared among the three classical grades of fatty liver by sonography.
Results: Grade 3 fatty liver, deep attenuation, and hepatomegaly demonstrated relatively high odds ratios for the presence of liver injury. Median L1+L2 and R1+R2+L1+L2 were significantly longer in patients with liver injury (164 mm [interquartile range, 149–178 mm] and 289 mm [267–314 mm]) than in those without (147 mm [130–156 mm] and 260 mm [247–281 mm], respectively; p<0.001 each). ALT levels, L1+L2, and R1+R2+L1+L2 increased with increasing fatty liver grade.
Conclusion: The present study suggests that grade 3 fatty liver, deep attenuation and/or hepatomegaly allow easy, non-invasive prediction of the presence of liver injury in elderly women with NAFLD using conventional sonography.
〔Lab Med Int 2023; 2(2): 30-38〕
Key Words
aminotransferase, hepatomegaly, liver injury, non-alcoholic fatty liver disease (NAFLD), sonography
I. Introduction
Non-alcoholic fatty liver disease (NAFLD) is considered a hepatic manifestation of metabolic syndrome1)-3). Patients with NAFLD often demonstrate liver injury, clinically recognizable as an elevated serum level of alanine aminotransferase (ALT)1)4). ALT is an enzyme released into the blood when hepatocytes are injured. Persistent liver injury can lead to hepatic fibrosis as an attempted restorative process in the tissue, eventually leading to liver cirrhosis1) and occasionally the development of liver cancer5). The presence of liver injury also correlates with the risk of atherosclerosis in patients with NAFLD6)7). Since the initial diagnosis of fatty liver is often made from abdominal sonography because of the availability, low cost, and non-invasiveness of this modality8)9), the ability to use sonographic data to predict the presence of liver injury would be particularly convenient. However, the relationship between liver injury and sonographic findings of fatty liver has yet to be clarified. Meanwhile, a new technique of sonography, the controlled attenuation parameter (CAP) using vibration-controlled transient elastography (VCTE), has recently been utilized to assess the grade of hepatic steatosis2)3)10)11). Another recent advance in evaluating hepatic steatosis is the attenuation coefficient (AC) using attenuation imaging (ATI), developed as two-dimensional B-mode sonography12)13). Not every medical setting, however, has access to such advanced modalities. The present study therefore attempted to elucidate whether the presence of liver injury in patients with NAFLD could be predicted using commonly available conventional sonography and what findings may hold promise for such prediction.
II. Methods
1.Subjects
Subjects comprised 81 female outpatients at our hospital (mean age, 62±14 years) with lifestyle-related diseases such as dyslipidemia, diabetes, and hypertension who had been diagnosed with fatty liver on abdominal sonography. Dyslipidemia was defined as having laboratory abnormalities of low-density lipoprotein cholesterol (>140 mg/dL), high-density lipoprotein cholesterol (<36 mg/dL) or triglycerides (>130 mg/dL). Diabetes was defined as having laboratory abnormalities of hemoglobin A1c (>5.8%). Hypertension was defined as abnormalities of systolic blood pressure (≥140 mmHg) or diastolic blood pressure (≥90 mmHg) at the time of consultation as an outpatient. Hyperuricemia was defined as having laboratory abnormalities of uric acid (>7.0 mg/dL). Patients who had already been treated with medications for these diseases were also included as patients having these lifestyle-related diseases, even if laboratory examination values were within normal ranges. Patients with habitual ethanol intake (>10 g/day), a history of seropositivity for hepatitis B or C virus, autoimmune disease, malignant tumors, or the use of medications that may modulate the results of blood tests for liver function were excluded from this study. Patients suspected as having liver fibrosis or chronic renal dysfunction were also excluded on the basis of blood test results and sonographic findings14). The present study therefore dealt with subjects considered to be showing early-stage NAFLD, not advanced-stage NAFLD such as liver cirrhosis.
Sonography
All sonographic examinations were performed using an Aplio ultrasound scanner (Canon Medical Systems Corporation, Tochigi, Japan) equipped with 3.5-MHz convex-array transducers. Fatty liver was diagnosed with high accuracy using conventional sonography, taking advantage of the 85% sensitivity and 94% specificity for detecting moderate to severe hepatic steatosis8). First, sonographic findings in patients were evaluated in terms of ‘fatty liver grade’, classified by a classical method into one of three grades15)-17). These three grades have been described on the basis of imaging differences, as follows: grade 1 (mild), slightly diffuse increase in echogenicity of liver parenchyma with normal visualization of the diaphragm and intrahepatic vessel borders; grade 2 (moderate), a moderate, diffuse increase in the echogenicity of liver parenchyma with slightly impaired visualization of intrahepatic vessels and diaphragm; and grade 3 (severe), a marked increase in the echogenicity of liver parenchyma with poor or absent visualization of intrahepatic vessels, diaphragm and posterior segment of the right lobe of the liver. Second, the presence or absence of blurred vessels, deep attenuation, focal spared areas and hepatomegaly were evaluated1)17). At this time, hepatomegaly was defined as poor visualization of posterior segment of the right lobe of the liver in subcostal scans. Hepatomegaly was therefore the same as one of the diagnostic criteria for grade 3 fatty liver. Third, liver size was quantitatively measured by applying the method used for measuring liver size in children18)19), since ‘hepatomegaly’ could be a qualitative evaluation by the sonographer. The measurement method was as follows: lengths from the midpoint of the horizontal portion of the portal vein to the anterior surface of the liver (R1) and to the deepest phrenic surface of the liver (R2) were measured from the right subcostal scan in sonography (Figure 1), and R1+R2 was used as a marker representing hepatic right lobe size. Lengths between the top and bottom (L1), and between the dorsal and ventral margins (L2) were then measured from the mid-longitudinal scan in sonography, and L1+L2 was used as a marker representing hepatic left lobe size. The sum of R1+R2 and L1+L2 was then taken as the measured liver size. A swollen right lobe such as observed in grade 3 fatty liver was not entirely visualized in the field of subcostal scanning for adults, since this measurement method has been established for measurement in children. In such cases, length from the portal horizontal portion to the bottom of scanning field was adopted as R2. Last, spleen size was assessed by calculating spleen index, as well as by measuring maximal length of the spleen20). All evaluations concerning fatty liver grade and the presence or absence of blurred vessels, deep attenuation, focal spared areas, and hepatomegaly were performed independently by one medical doctor specializing in sonography and two skilled sonographers for each image. Evaluations were performed under blinded conditions, with no investigator aware of patient clinical histories. Mean results were adopted to minimize any observer bias.
2.Blood examination
Blood tests performed on the days of sonographic examinations were evaluated, including liver function tests such as aspartate aminotransferase (AST), γ-glutamyl transpeptidase (GGT), alkaline phosphatase, and ALT. Blood tests also included those related to the severity of lifestyle-related diseases, such as triglycerides, high-density lipoprotein cholesterol, low-density lipoprotein cholesterol, glucose, hemoglobin A1c, and uric acid levels. Platelet count was also assessed to exclude patients who had already developed hepatic fibrosis1)14)21). AST-to-ALT ratio (AST/ALT ratio) was also calculated, since an increased value for this ratio to >1 suggests hepatic fibrosis22)23). These values were used because sonography is not good at detecting hepatic steatosis when advanced fibrosis is present in the liver11).
3.Analyses
Patients were divided into two groups according to the presence (ALT >30 IU/L, upper limit of the reference range) or absence of liver injury. Clinical features, blood examination results and sonographic findings from patients were compared between these two groups. Since some data showed non-normal distributions using the Shapiro-Wilk test, descriptive results are presented as median values with interquartile ranges (IQRs) in the text and as box-and-whisker plots of medians with quartiles and minimum and maximum values in the figures. To assess the significance of differences in sonographic findings to predict the presence of liver injury, the Mann-Whitney test was applied to compare the groups with and without liver injury for continuous data, and Pearson’s chi-square test or Fisher’s exact probability test for contingency table data. When a significant finding was detected (p<0.05) for contingency table data, adjusted residuals were then analyzed to confirm the significance of the finding for the presence or absence of liver injury. At this time, adjusted residuals >1.96 and >2.58 were considered to correspond to significant values of p<0.05 and p<0.01, respectively. To identify findings predicting the presence of liver injury, the odds ratio of each sonographic finding for the presence of liver injury was calculated. For measured liver size, the cut-off values of R1+R2, L1+L2, and R1+R2+L1+L2 for detecting serum ALT abnormality as determined using receiver operating characteristic (ROC) analyses were employed as criteria. Odds ratios for the presence of liver injury were also assessed according to the presence of each lifestyle-related disease. Next, ALT levels and liver size measured as R1+R2, L1+L2, or R1+R2+L1+L2 on sonography which had exhibited significant differences between patients with and without liver injury, were compared among the three grades of fatty liver. The Kruskal-Wallis test and subsequent Bonferroni correction for multiple comparisons were used for comparisons among the three fatty liver grades. Values of p<0.05 after Bonferroni correction were considered statistically significant. Informed consent for sonography and blood examination was obtained from each patient. All study protocols were approved by the ethics committee of our institute (approval number: 348). All procedures were performed in accordance with the ethical standards formulated in the Declaration of Helsinki and its revisions.
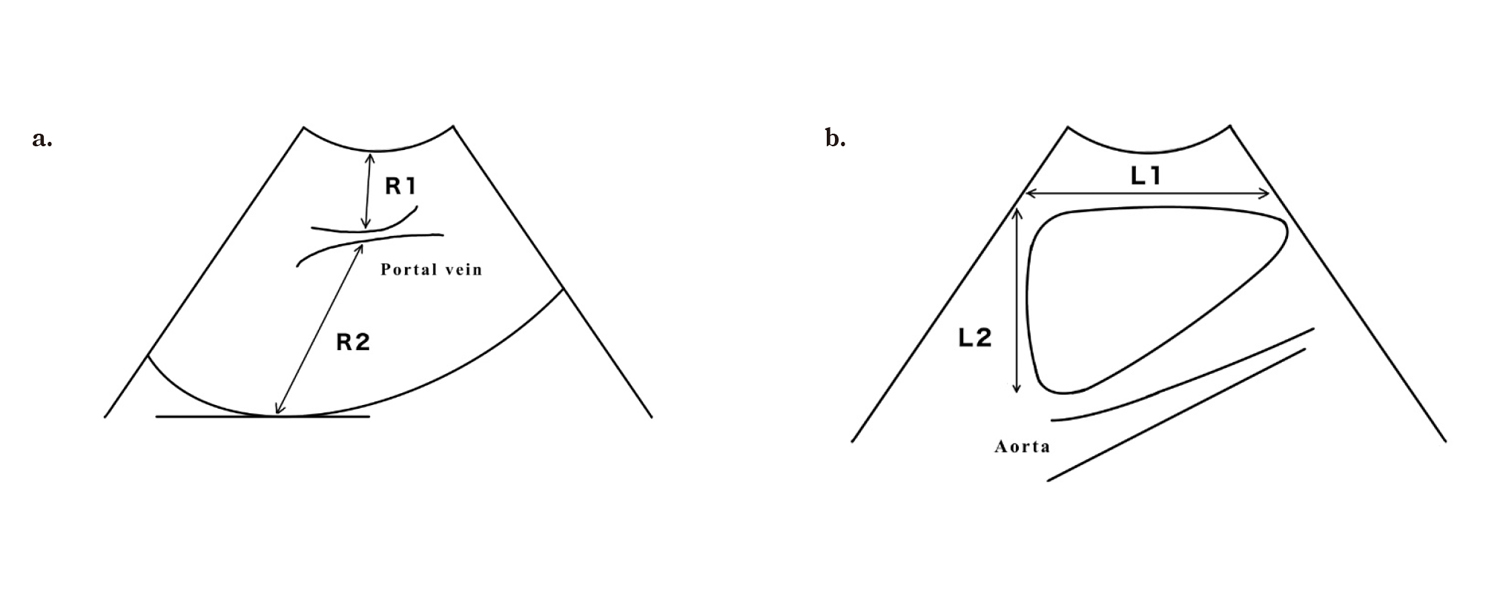
Figure 1 Measurement of liver size
a) Lengths from the midpoint of the horizontal portion of the portal vein to the anterior surface of the liver (R1) and to the deepest phrenic surface of the liver (R2) on the right subcostal scan in sonography, for calculation of R1+R2 as a marker of hepatic right lobe size.
b) Lengths between the top and bottom (L1) and between the dorsal and ventral margins (L2) on the mid-longitudinal scan in sonography, for calculation of L1+L2 as a marker of hepatic left lobe size.
III. Results
The clinical features of patients are presented in Table 1. Age was significantly lower in patients with liver injury (61 years, IQR 48–69 years) than in those without (63 years, IQR 59–74 years; p=0.039). Presence of lifestyle-related diseases did not differ significantly between groups. Concerning laboratory data other than ALT, both AST and GGT levels were significantly higher in patients with liver injury than in those without. The ratio of AST to ALT in patients with liver injury was less than 1 (0.70, IQR 0.64–0.89), whereas that in patients without liver injury was more than 1 (1.05, IQR 0.91–1.18). No differences in blood examination findings related to lifestyle-related diseases were seen between patients with and without liver injury. Platelet counts likewise did not differ between groups and were within normal range (liver injury: 22.4 ×10⁴/μL, IQR 19.5–24.9 ×10⁴/μL; without liver injury: 21.4 ×10⁴/μL, IQR 18.1–25.0 ×10⁴/μL; p=0.562). As for sonographic findings, grade 2 or 3, blurred vessels, deep attenuation, and hepatomegaly were more frequent in patients with liver injury than in those without liver injury (Table 1). Grade 3 fatty liver was a significant finding for confirming the presence of liver injury (adjusted residuals 2.5, corresponding to p<0.05), while grade 1 fatty liver was for confirming the absence of liver injury (adjusted residuals 3.1, corresponding to p<0.01). Blurred vessels (adjusted residuals 2.4, corresponding to p<0.05), deep attenuation (adjusted residuals 2.7, corresponding to p<0.01) and hepatomegaly (adjusted residuals 5.2, corresponding to p<0.01) were also significantly associated with the presence of liver injury. L1+L2 was significantly longer in patients with liver injury (164 mm, IQR 149–178 mm) than in patients without (147 mm, IQR 130–156 mm; p<0.001), although R1+R2 did not differ significantly between groups. R1+R2+L1+L2 was also significantly longer in patients with liver injury (289 mm, IQR 267–314 mm) than in patients without (260 mm, IQR 247–281 mm; p<0.001). In contrast to liver size, spleen size did not differ between groups. The cut-off values of L1+L2 and R1+R2+L1+L2 for detecting serum ALT abnormality from ROC analyses were 162 mm (area under the curve [AUC] 0.759) and 260 mm (AUC 0.746), respectively. According to odds ratios, patients showing grade 3 fatty liver, deep attenuation, hepatomegaly, L1+L2 >162 mm, and R1+R2+L1+L2 >260 mm were suggested to show a relatively high risk of liver injury (Table 2). In contrast, the presence of lifestyle-related diseases was not associated with the presence of liver injury in patients with NAFLD.
Serum ALT levels increased with increasing fatty liver grade (grade 1: 22 IU/L, IQR 18–30 IU/L; grade 2: 32 IU/L, IQR 20–62 IU/L; grade 3: 56 IU/L, IQR 43–87 IU/L) (Figure 2). Liver size as measured by L1+L2 (grade 1: 144 mm, IQR 128–154 mm; grade 2: 155 mm, IQR 147–168 mm; grade 3: 190 mm, IQR 173–200 mm) and R1+R2+L1+L2 (grade 1: 256 mm, IQR 244–278 mm; grade 2: 279 mm, IQR 265–294 mm; grade 3: 320 mm, IQR 306–334 mm) also increased with increasing fatty liver grade (Figure 3).
Table 1 Comparison between patients with and without liver injury.
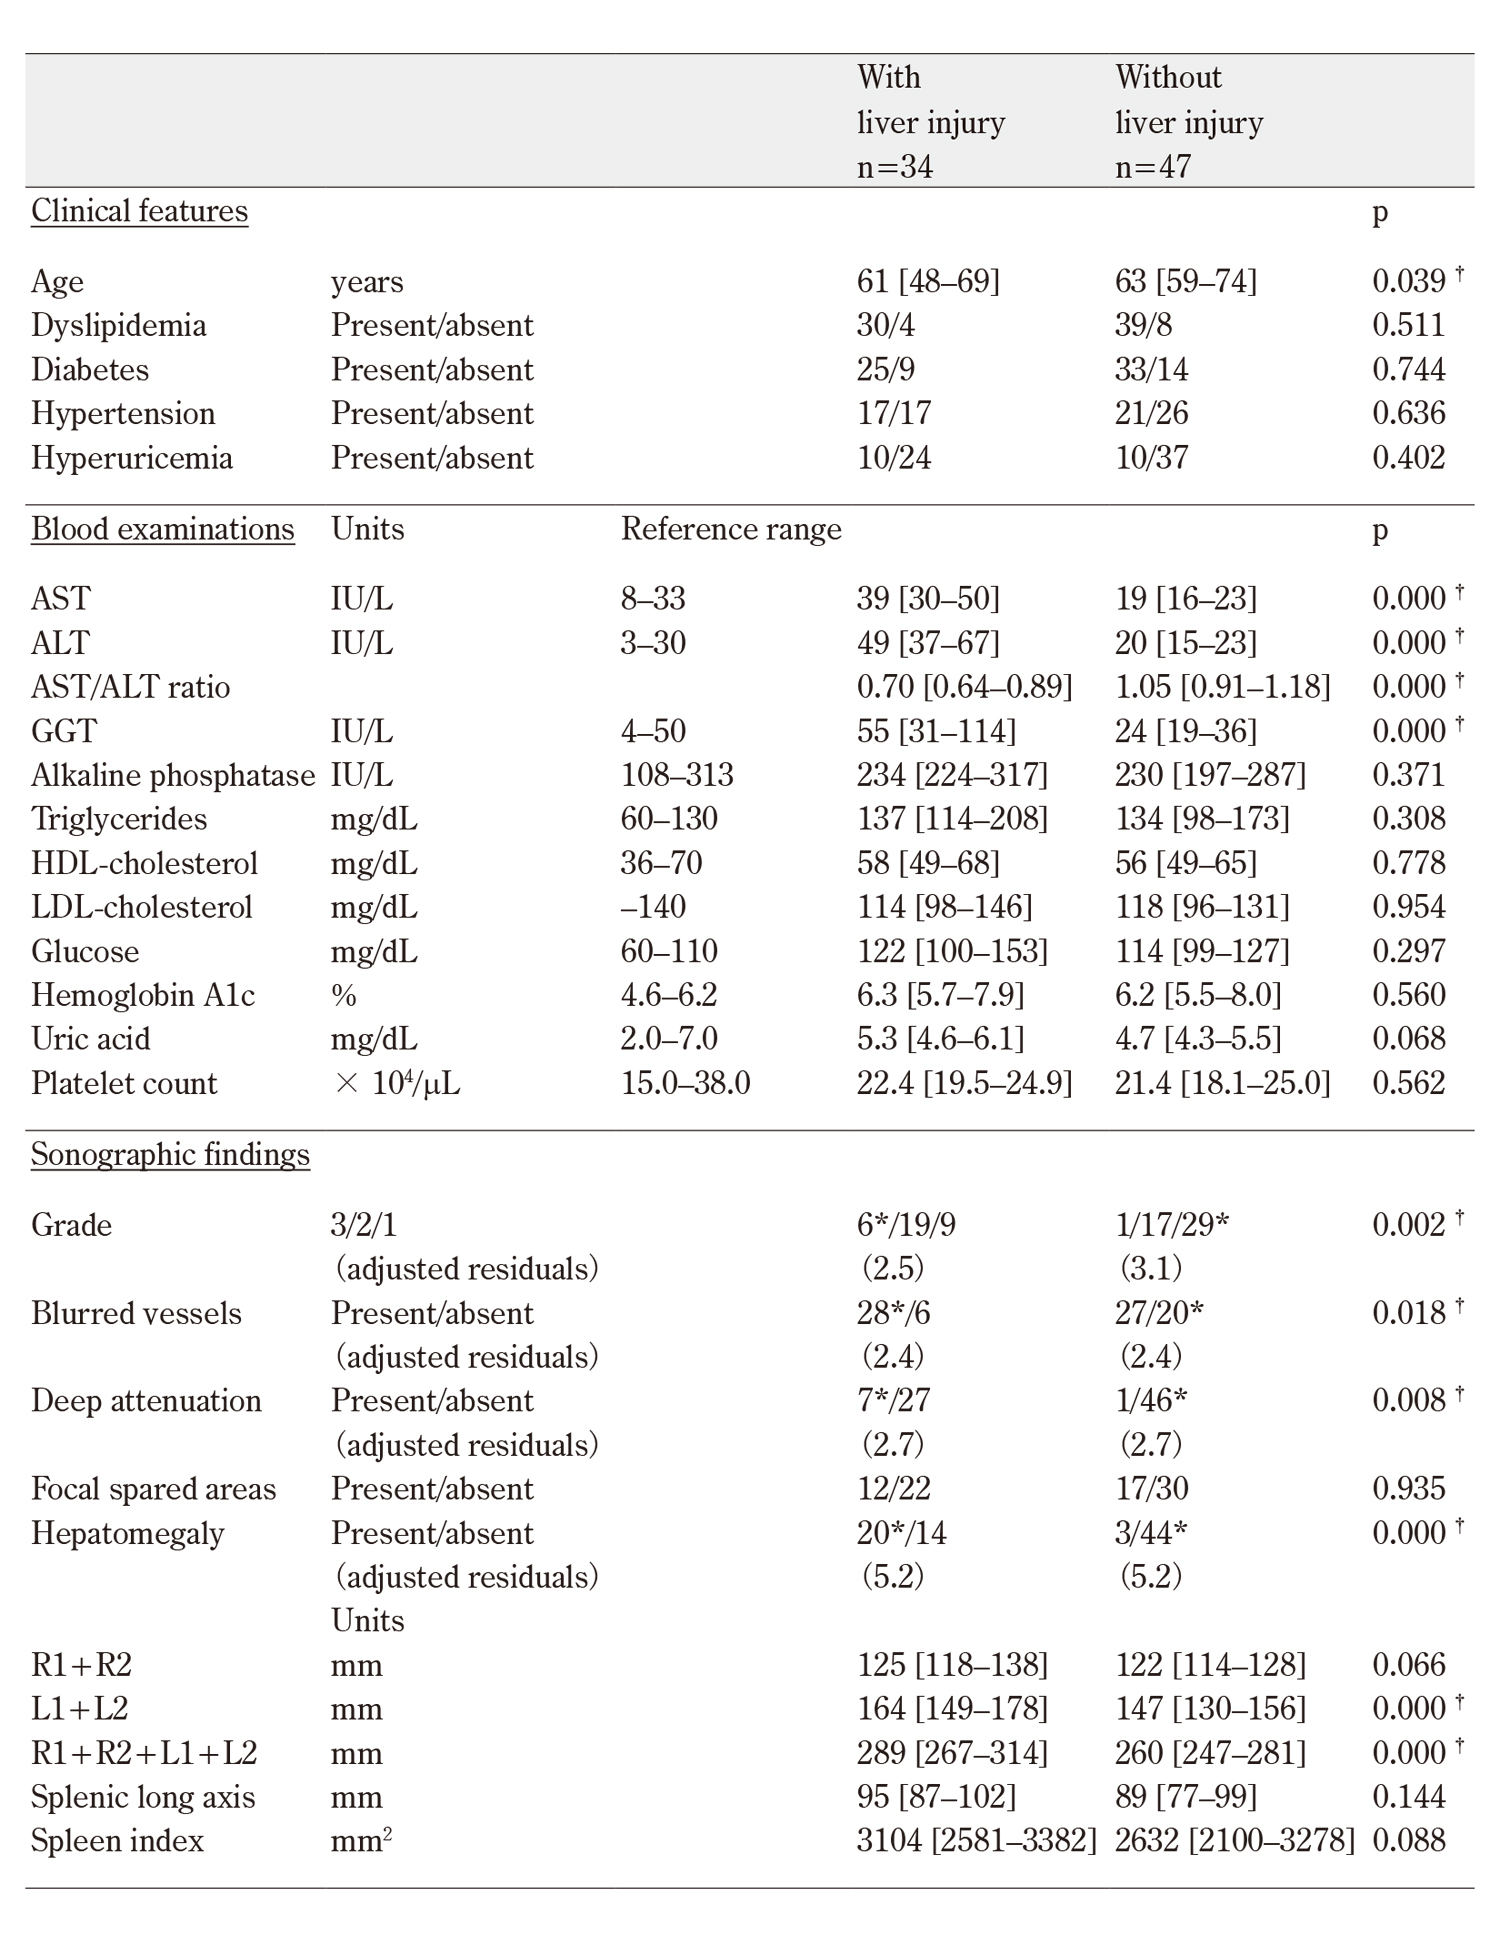
Results are presented as median [interquartile range] for continuous data, and as the number of patients with or without (present/absent) each sonographic finding. Abbreviations: ALT, alanine aminotransferase; AST, aspartate aminotransferase; GGT, γ-glutamyl transpeptidase; HDL, high-density lipoprotein; LDL, low-density lipoprotein. †p<0.05, Mann-Whitney U-test, Pearson’s chi-square test, or Fisher’s exact probability test. *p<0.05, adjusted residuals. Significance of adjusted residuals is shown for the presence of each sonographic finding, not the absence, to characterize presence or absence of liver injury. Adjusted residuals >1.96 and >2.58 were taken to correspond to statistically significant values of p<0.05 and p<0.01, respectively.
IV. Discussion
This is the first study to examine whether the presence of liver injury can be predicted in elderly women with NAFLD on the basis of findings from conventional sonography, and what findings could prove promising on examination. The present findings suggest fatty liver grade 3, deep attenuation, and hepatomegaly also represented by L1+L2 or R1+R2+L1+L2 as reliable candidate predictors of the presence of liver injury (Tables 1, 2; Figures 2, 3). The results also suggest that fatty liver grading by sonography is useful for predicting the severity of liver injury and hepatomegaly.
Grade 3 fatty liver is considered reflective of severe fat deposition in the liver15)17), which in turn causes hepatomegaly24) and deep attenuation on sonographic images. These three findings were thus essentially linked. Concerning liver size, grade 3 was actually more closely associated with larger liver size than the other grades of fatty liver on the measured scale (Figure 3). Among the criteria for diagnosis of grade 315)17), increased echogenicity of liver parenchyma and impaired visualization of intrahepatic vessels and the diaphragm might not be readily distinguishable from the criteria for grade 2, depending on the subjective opinion of the observer. Conversely, the other criterion for diagnosis of grade 3, impaired visualization of the posterior right lobe, could be judged objectively since the posterior right lobe could not be visualized within the margin of the sonographic image due to hepatomegaly. Deep attenuation, the other candidate for predicting the presence of liver injury, also correlated with the finding of grade 3, since this impairs visualization of the posterior right lobe on sonography. Grade 3 demonstrating poor or absent visualization of the posterior segment of the right lobe due to hepatomegaly and/or deep attenuation could thus represent a promising finding for predicting the presence of liver injury on sonography. This conclusion may be consistent with results from magnetic resonance imaging (MRI) on pediatric patients with NAFLD, demonstrating correlations between serum ALT levels and hepatic fat content25)-27) or between serum ALT levels and liver volume28). However, sonography offers advantages over MRI in terms of convenience and cost-benefit ratio.
Non-invasive imaging methods have been developed to evaluate the degree of hepatic steatosis, since liver biopsy, as a gold standard for diagnosing NAFLD, is an invasive procedure that is unlikely to be applied widely in clinical settings9)11). Concerning sonography, a scoring system using sonographic findings has been reported29). However, that system was established only for evaluating the degree of hepatic steatosis, not for predicting the presence of liver injury. Scoring using this method in daily clinical settings might also be somewhat complicated. In the present study, grade 3 fatty liver, deep attenuation and hepatomegaly demonstrated a high (>10×) odds ratio for the presence of liver injury, suggesting that these indices can be individually applied to select patients warranting precise investigations of liver injury.
Meanwhile, CAP from simultaneous VCTE and AC from ATI are recent advances in sonographic techniques, based on the process of measuring the degree of sonographic attenuation due to hepatic steatosis2)3)10)-13). CAP and AC thus offer objective and precise imaging methods to noninvasively evaluate the degree of fatty liver. The FibroScan-AST score (FAST) can predict not only the degree of hepatic steatosis, but also the degree of hepatic fibrosis as a criterion for total staging of NAFLD patients30)31). The presence or absence of liver injury in patients with NAFLD could therefore also be recognized by measuring CAP with FAST scoring, or AC from ATI. However, not every medical setting has ready access to such advanced modalities. The present study suggests that widely used conventional sonography could help recognize the presence of liver injury in NAFLD patients in facilities without the equipment required to measure CAP or AC.
The precise relationship between severe fat deposition in the liver and development of liver injury remains unclear. One possible pathogenesis is that alterations in sinusoidal blood flow in enlarged liver due to severe fat deposition could activate Kupffer cells (hepatic macrophages), releasing inflammatory cytokines that then injure the liver3)32). Another possibility is that an increased influx of fatty acids into the liver through portal flow derived from accumulated abdominal visceral adipose tissue, a primary factor in developing fatty liver together with obesity, could be metabolized to reactive oxygen species that injure the liver1)33). Other inflammatory cytokines could be also released from this accumulated abdominal visceral adipose tissue, flow into the liver via the portal vein, and injure the liver33).
As a limitation, this study was a cross-sectional investigation, and follow-up observation is required to evaluate whether the presence or absence of liver injury could change according to changes in sonographic finding. Patients with liver injury were slightly younger than those without liver injury. Differences in dietary habits might also have somewhat affected the results of the present study. The subject cohort was limited to elderly women. Men or younger women might exhibit other characteristics. R2 was not completely measured within the scanning field in adults, since the measurement method adopted in the present study was that for children. This might be one reason why R1+R2 did not differ significantly between patients with and without liver injury (Table 1). The relationships between findings in the present study and values using CAP from VCTE or AC from ATI should be clarified.
Table 2 Odds ratio of each sonographic finding for the presence of liver injury
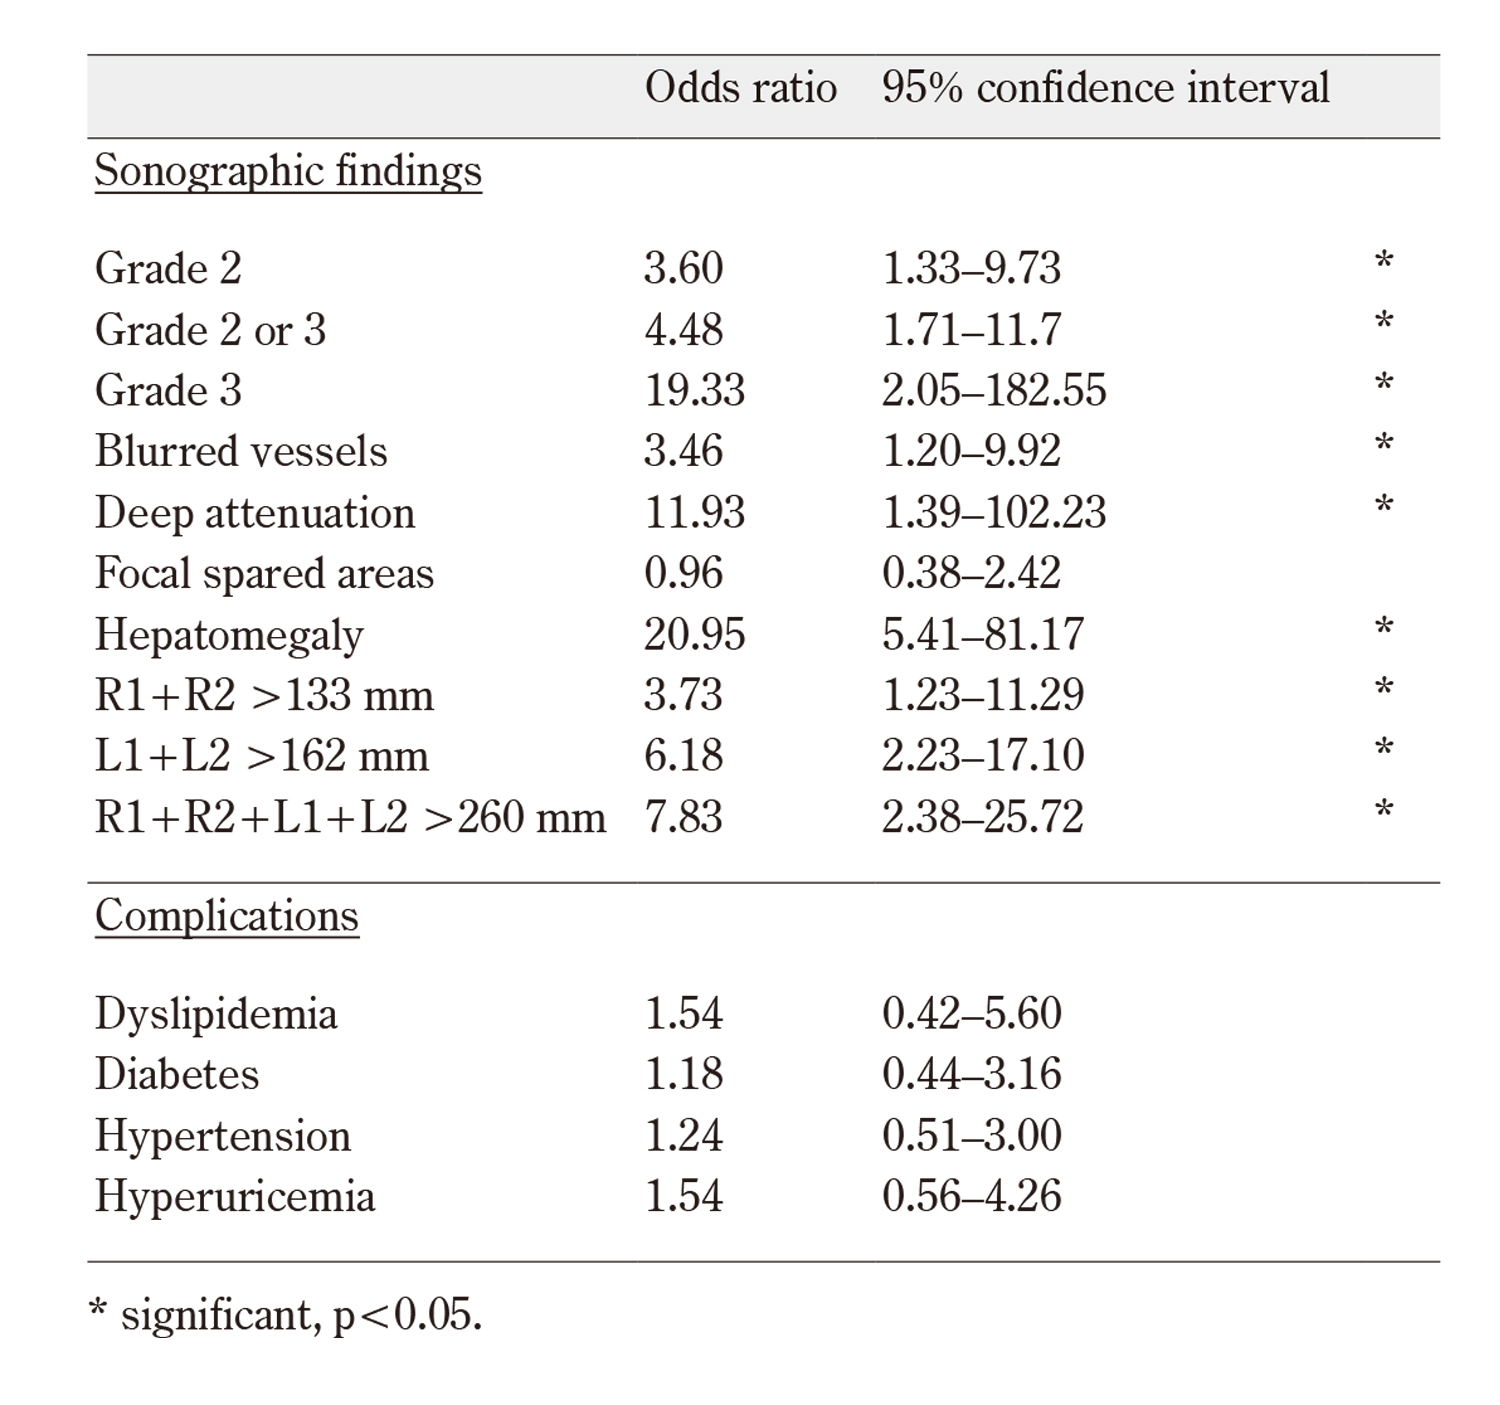
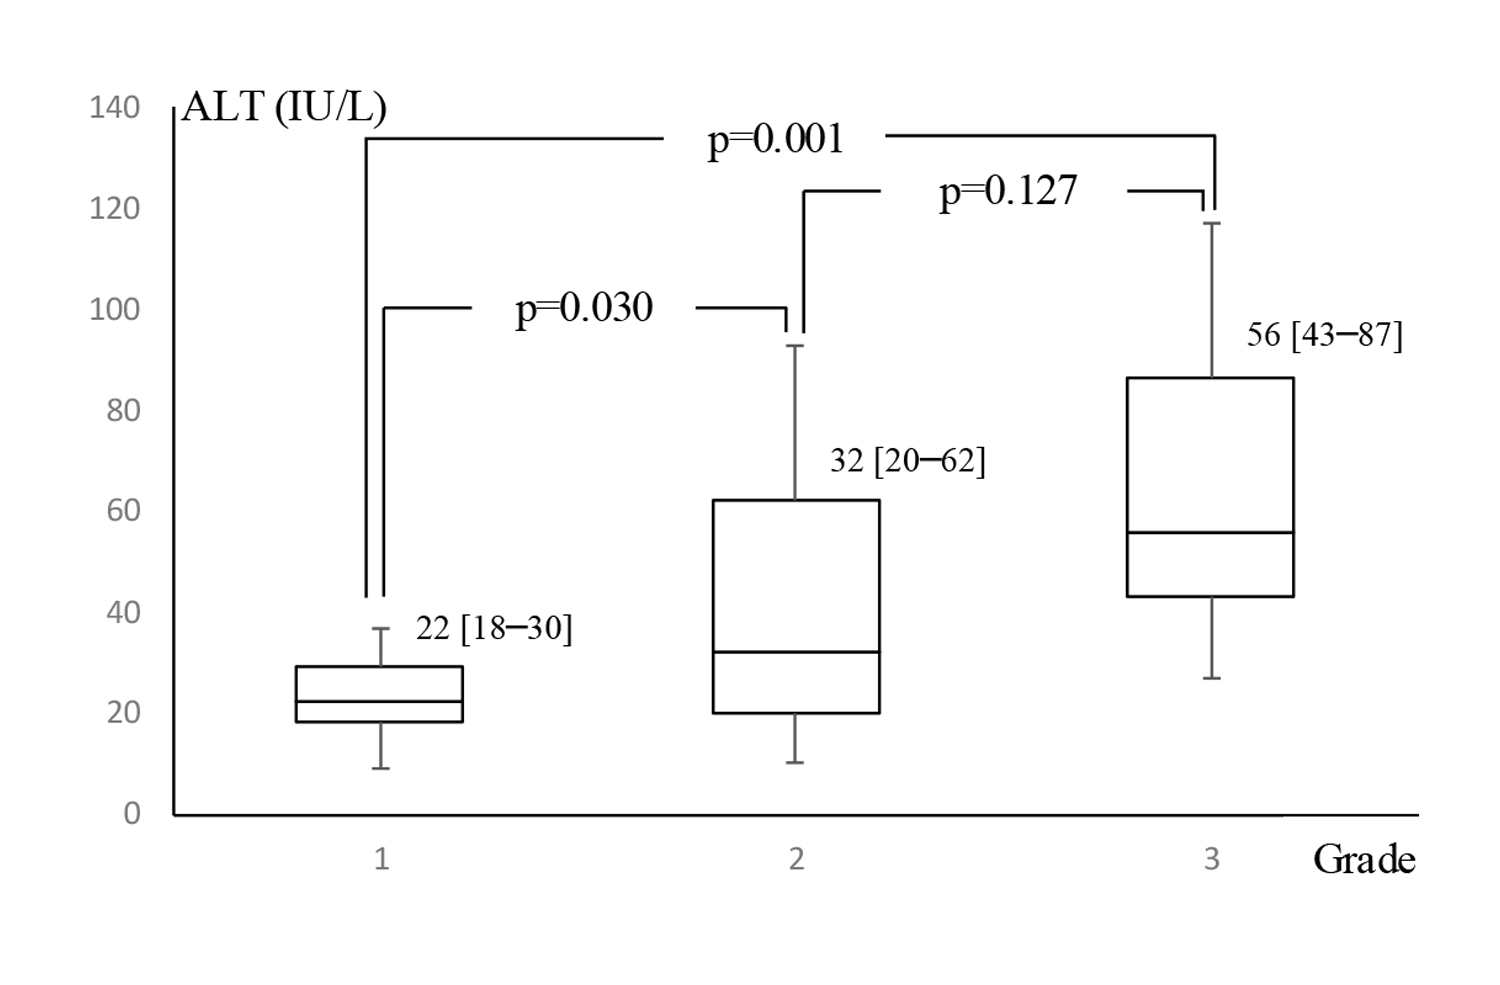
Figure 2 Serum alanine aminotransferase (ALT) levels by fatty liver grade
The upper limit of the normal range for ALT is 30 IU/L. Box-and-whisker plots show an increase in serum alanine aminotransferase (ALT) levels with each fatty liver grade (grade 1: n=38; grade 2: n=36; grade 3: n=7). The bottom and top of each box represent the 25th and 75th percentiles, respectively. The line through the box denotes the median, and the whiskers denote the minimum and maximum values. Values are presented as medians with quartiles. Bonferroni correction for multiple comparisons was used for comparisons among the three fatty liver grades. These adjusted values of p<0.05 were considered statistically significant.
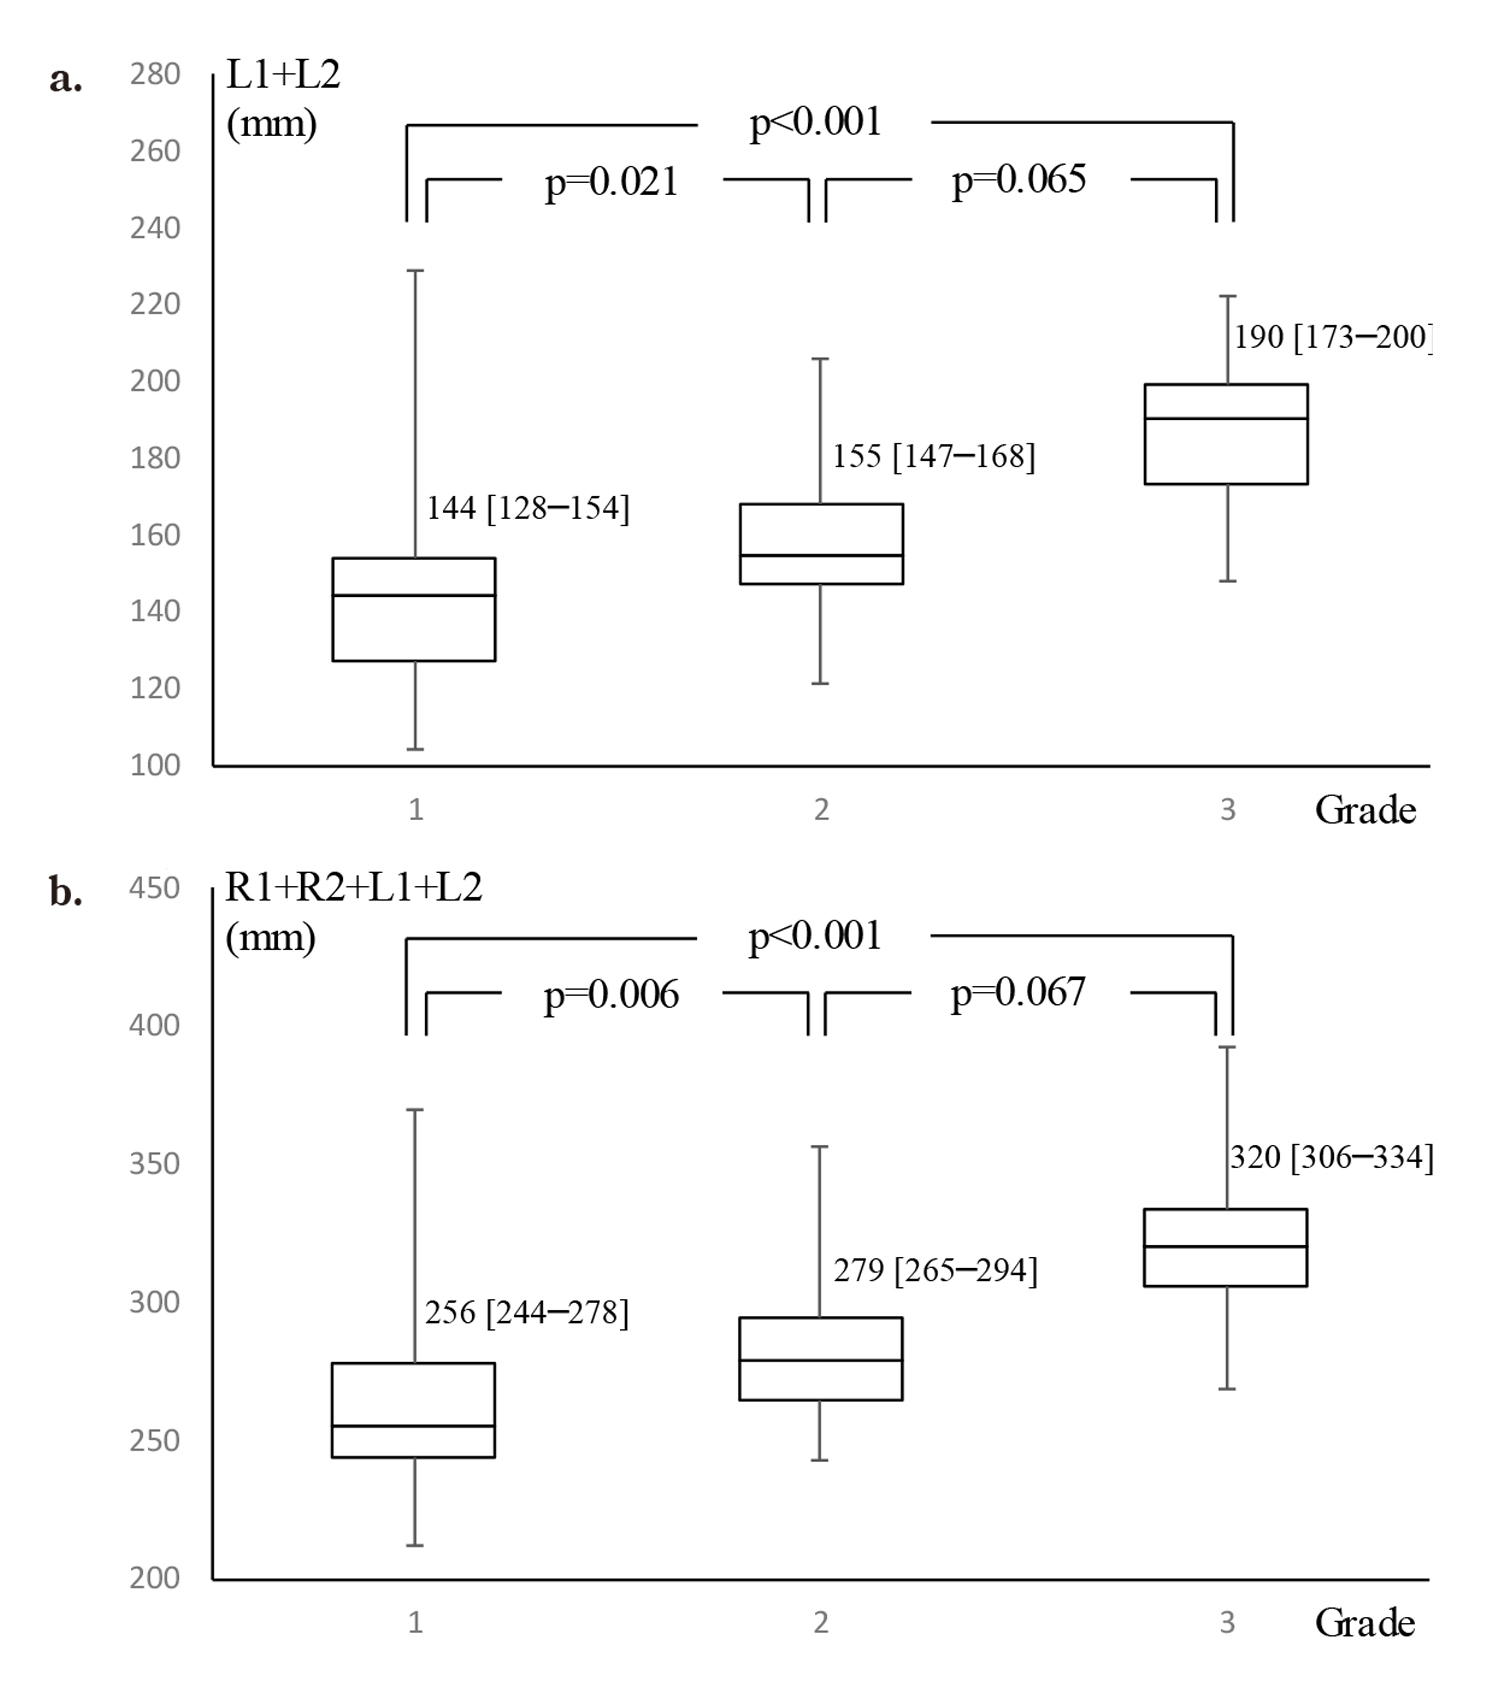
Figure 3 Length L1+L2 and R1+R2+L1+L2 by fatty liver grade
Box-and-whisker plots show increases in lengths L1+L2 (a) and R1+R2+L1+L2 (b) with each fatty liver grade (grade 1: n=38; grade 2: n=36; grade 3: n=7). The bottom and top of each box represent the 25th and 75th percentiles, respectively. The line through the box denotes the median, and the whiskers denote the minimum and maximum values. Values are presented as medians with quartiles. Bonferroni correction for multiple comparisons was used for comparisons among the three fatty liver grades. These adjusted values of p<0.05 were considered statistically significant.
V. Conclusion
The present study suggests that grade 3 fatty liver, hepatomegaly and/or deep attenuation could offer promising findings for easy, non-invasive prediction of the presence of liver injury in elderly women with NAFLD using conventional sonography.
Acknowledgement
This work was supported by research funds from the Kyorin University Faculty of Health Sciences (Grant Number: R401010001) and the Japan Society for the Promotion of Science KAKENHI (Grant Number: 21K12756).
Disclosure
No potential conflicts of interest were disclosed.
References
- Angulo P. Nonalcoholic fatty liver disease. N Engl J Med 2002; 346(16): 1221-31.
- Sheka AC, Adeyi O, Thompson J, et al. Nonalcoholic steatohepatitis: A review. JAMA 2020; 323(12): 1175-83.PubMed
- Powell EE, Wong VW, Rinella M. Non-alcoholic fatty liver disease. Lancet 2021; 397 (10290): 2212-24.PubMed
- Mells G, Alexander G. Markers of hepatocellular injury: The serum transaminases. In: Dooley JS, Lok ASF, Garcia-Tsao G, Pinzani M, editors. Sherlock’s Diseases of the Liver and Biliary System. 13th ed. Hoboken: Wiley-Blackwell; 2018. p.32-3.
- White DL, Kanwal F, El-Serag HB. Association between nonalcoholic fatty liver disease and risk for hepatocellular cancer, based on systematic review. Clin Gastroenterol Hepatol 2012; 10(12): 1342-59.e2.PubMed
- Schindhelm RK, Dekker JM, Nijpels G, et al. Alanine aminotransferase predicts coronary heart disease events: A 10-year follow-up of the Hoorn Study. Atherosclerosis 2007; 191(2): 391-6.PubMed
- Wang CC, Lin SK, Tseng YF, et al. Elevation of serum aminotransferase activity increases risk of carotid atherosclerosis in patients with non-alcoholic fatty liver disease. J Gastroenterol Hepatol 2009; 24(8): 1411-6.PubMed
- Hernaez R, Lazo M, Bonekamp S, et al. Diagnostic accuracy and reliability of ultrasonography for the detection of fatty liver: A meta-analysis. Hepatology 2011; 54 (3): 1082-90.PubMed
- Wong VW, Adams LA, de Lédinghen V, et al. Noninvasive biomarkers in NAFLD and NASH – current progress and future promise. Nat Rev Gastroenterol Hepatol 2018; 15(8): 461-78.PubMed
- Sasso M, Beaugrand M, de Ledinghen V, et al. Controlled attenuation parameter (CAP): A novel VCTE™ guided ultrasonic attenuation measurement for the evaluation of hepatic steatosis: Preliminary study and validation in a cohort of patients with chronic liver disease from various causes. Ultrasound Med Biol 2010; 36 (11): 1825-35.PubMed
- Hannah WN Jr, Harrison SA. Noninvasive imaging methods to determine severity of nonalcoholic fatty liver disease and nonalcoholic steatohepatitis. Hepatology 2016; 64(6): 2234-43.PubMed
- Tada T, Iijima H, Kobayashi N, et al. Usefulness of attenuation imaging with an ultrasound scanner for the evaluation of hepatic steatosis. Ultrasound Med Biol 2019; 45(10): 2679-87.PubMed
- Lee DH. Quantitative assessment of fatty liver using ultrasound attenuation imaging. J Med Ultrason (2001) 2021; 48(4): 465-70.PubMed
- Renou C, Muller P, Jouve E, et al. Revelance of moderate isolated thrombopenia as a strong predictive marker of cirrhosis in patients with chronic hepatitis C virus. Am J Gastroenterol 2001; 96(5): 1657-9.PubMed
- Saadeh S, Younossi ZM, Remer EM, et al. The utility of radiological imaging in nonalcoholic fatty liver disease. Gastroenterology 2002; 123(3): 745-50.PubMed
- Hagen-Ansert SL: Liver. In: Hagen-Ansert SL, editor. Textbook of Diagnostic Sonography. 8th ed. Volume One. Amsterdam: Elsevier; 2017. p.190-247.
- Wilson SR, Withers CE: The Liver. In: Rumack CM, Levine D, editors. Diagnostic Ultrasound. Volume One. Amsterdam: Elsevier; 2017. p.74-138.
- Yokota K, Wang Y, Ono T, et al. Use of ultrasonography to measure liver size in children. J Med Ultrasonics 2000; 27(7): 973-80. (In Japanese with English abstract)NIH
- Yokota K, Itoh K, Nakamura M, et al. Evaluation of hepatomegaly in children using ultrasonography. J Jpn Pediatr Soc 2001; 105(11): 1222-6. (In Japanese with English abstract)
- Ishibashi H, Higuchi N, Shimamura R, et al. Sonographic assessment and grading of spleen size. J Clin Ultrasound 1991; 19(1): 21-5.PubMed
- Petta S, Sebastiani G, Bugianesi E, et al. Non-invasive prediction of esophageal varices by stiffness and platelet in non-alcoholic fatty liver disease cirrhosis. J Hepatol 2018; 69(4): 878-85.PubMed
- Sheth SG, Flamm SL, Gordon FD, et al. AST/ALT ratio predicts cirrhosis in patients with chronic hepatitis C virus infection. Am J Gastroenterol 1998; 93(1): 44-8.PubMed
- Åberg F, Danford CJ, Thiele M, et al. A dynamic aspartate-to-alanine aminotransferase ratio provides valid predictions of incident severe liver disease. Hepatol Commun 2021; 5(6): 1021-35.PubMed
- Hardy T, Day CP. Non-alcoholic fatty liver disease. In: Dooley JS, Lok ASF, Garcia-Tsao G, Pinzani M, editors. Sherlock’s Diseases of the Liver and Biliary System. 13th ed. Hoboken: Wiley-Blackwell; 2018. p.540-60.
- Fishbein MH, Miner M, Mogren C, et al. The spectrum of fatty liver in obese children and the relationship of serum aminotransferases to severity of steatosis. J Pediatr Gastroenterol Nutr 2003; 36(1): 54-61.PubMed
- Fishbein MH, Mogren C, Gleason T, et al. Relationship of hepatic steatosis to adipose tissue distribution in pediatric nonalcoholic fatty liver disease. J Pediatr Gastroenterol Nutr 2006; 42(1): 83-8.PubMed
- Pacifico L, Celestre M, Anania C, et al. MRI and ultrasound for hepatic fat quantification: Relationships to clinical and metabolic characteristics of pediatric nonalcoholic fatty liver disease. Acta Paediatr 2007; 96(4): 542-7.PubMed
- Busetto L, Tregnaghi A, De Marchi F, et al. Liver volume and visceral obesity in women with hepatic steatosis undergoing gastric banding. Obes Res 2002; 10(5): 408-11.PubMed
- Hamaguchi M, Kojima T, Itoh Y, et al. The severity of ultrasonographic findings in nonalcoholic fatty liver disease reflects the metabolic syndrome and visceral fat accumulation. Am J Gastroenterol 2007; 102(12): 2708-15.PubMed
- Noureddin N, Alkhouri N, Brown KA, et al. Driving nonalcoholic steatohepatitis forward using the FibroScan aspartate aminotransferase score, but obey the traffic lights. Hepatology 2020; 72(6): 2228-30.PubMed
- Fujii H, Fukumoto S, Enomoto M, et al. The FibroScan-aspartate aminotransferase score can stratify the disease severity in a Japanese cohort with fatty liver diseases. Sci Rep 2021; 11(1): 13844.PubMed
- Farrell GC, Teoh NC, McCuskey RS. Hepatic microcirculation in fatty liver disease. Anat Rec (Hoboken) 2008; 291(6): 684-92.PubMed
- Petta S, Muratore C, Craxì A. Non-alcoholic fatty liver disease pathogenesis: The present and the future. Dig Liver Dis 2009; 41(9): 615-25.PubMed