Takeshi Hirashima*1 MD., Ema Aoki*1 MD, Yuko Kumamoto*2, Natsuko Suzuki*1 MD,
Taito Oshima*1 MD, †Tsutomu Hirano*1 MD, PhD
Cite
Hirashima T, Aoki E, Kumamoto Y, Suzuki N, Oshima T, Hirano T. Association of skin autofluorescence with diabetic complications after adjusting confounding factors, a cross-sectional study in a regional diabetic cohort. Lab Med Int 2023; 2(1): 3-10. doi: 10.51041/lmi.2.1_3
Original
Lab Med Int 2023; 2(1): 3-10
Correspondence: Diabetes Center, Ebina general hospital, Kawaharaguchi 1320 Ebina City, Kanagawa, Japan . Zip cord 243-0433
E-mail: hirano”@”med.showa-u.ac.jp
Received January 6, 2022; accepted March 22, 2022
*1 Diabetes Center, Ebina General Hospital
*2 Department of Clinical Laboratory, Ebina General Hospital
ABSTRACT
Background: Skin autofluorescence (SAF) is a non-invasive marker of advanced glycation end-product (AGE) accumulation and may explain glycemic memory in diabetic patients. However, the clinical usefulness of SAF measurement is not well recognized due to its complex confounding factors. We investigated how SAF is associated with diabetic complications after adjusting for confounding factors.
Methods: Patients with type 2 diabetes (n = 1130) enrolled in the regional diabetes cohort (ViNA cohort) were examined at baseline. SAF was measured by a AGE Reader. Ankle-brachial pressure index (ABI) was measured for diagnosis of peripheral artery disease (PAD) (ABI≦0.9). Diabetic kidney disease (DKD) was defined as urinary albumin-creatinine ratio≧ 30 mg/g and estimated glomerular filtration rate (eGFR) < 60 mL/min/1.73 m2, diabetes duration ≧ 5 years, and the presence of diabetic retinopathy. The visceral fat area (VFA) was measured by computed tomography.
Results: SAF was significantly correlated with age, duration of diabetes, and decreased eGFR. SAF was associated with diabetic retinopathy, strictly defined DKD, and stroke, but after adjusting for these confounding factors, it was no longer associated with coronary artery disease or PAD. SAF was not associated with metabolic syndrome-related risk factors, such as VFA and serum lipids.
Conclusions: SAF is affected by age, duration of diabetes, and kidney function, so careful analysis is required when assessing the clinical significance of SAF. Nevertheless, SAF is an excellent biomarker for diabetic retinopathy, DKD, and stroke.
〔Lab Med Int 2023; 2(1): 3-10〕
Key Words
Skin autofluorescence, diabetic complications, biomarkers
I. Introduction
Hyperglycemia is a major risk factor for macrovascular and microvascular complications in the diabetic population 1), and advanced glycation end-product (AGE) accumulation in the vasculature is compelling mechanism to explain between long-term high glucose exposure and angiopathy 2)3). A past history of hyperglycemia or strict glycemic control may accelerate or suppress the subsequent development of diabetic complications, known as glycemic (metabolic) memory 4) or legacy effects 5). Since AGE production is stimulated by long-term hyperglycemia 6), it is expected that measuring AGE can assess the risk of diabetic complications beyond HbA1c levels which indicate current glycemic control. AGE-Reader is widely used as a noninvasive clinical tool for detecting tissue autofluorescence (AF) under the skin (SAF)7), which is highly related to the accumulation of AGE such as pentosidine and carboxy(m)ethyllysin under the skin 8). However, while SAF can be easily measured in a general clinical practice, the clinical usefulness of the measurement is not well recognized.
Numerous publications have revealed that SAF is closely associated with microvascular and macrovascular complications in patients with diabetes 6)-11). Therefore, SAF measurements may help to detect or predict diabetic complications in routine clinical work. However, there are some issues that interfere with SAF from useful biomarkers for diabetic complications. SAF increases with aging 11), duration of diabetes 12), and renal dysfunction 13). The age and duration of diabetes are also strong determinants of diabetic complications, and chronic kidney disease (CKD) is an established risk factor for atherosclerotic cardiovascular disease (ASCVD)14). Therefore, careful analysis is required when assessing the clinical importance of SAF in consideration of confounding factors. Moreover, many reports on SAF target patients with type 1 diabetes with a simple background 6)15), and glucose toxicity is easy to detect. Patients with type 2 diabetes have more complex backgrounds and treatments than patients with type 1 diabetes. Therefore, the clinical importance of SAF in type 1 diabetes cannot be easily applied to type 2 diabetes. This study investigated the association between SAF and diabetic complications after adjusting for age, duration of diabetes, and estimated glomerular filtration rate (eGFR) in a large number of patients with type 2 diabetes.
II. Methods
Patients with type 2 diabetes (n = 1130) was examined who were a participant in the “ViNA” cohort study to investigate the prognosis of diabetic patients at Ebina General Hospital. The clinical characteristics of the subjects are shown in Table 1. Nineteen percent patients were insulin users and 4% were glucagon-like peptide-1 receptor agonists (GLP-1RA) users. Most subjects were treated with the following oral anti-diabetes drugs (OADs) alone or in combination: a sulfonylurea (n = 344), metformin (n = 546), pioglitazone (n = 63), dipeptidyl peptidase(DPP)-4 inhibitor (n=756), sodium-glucose cotransporter (SGLT)-2 inhibitor (n=275), and α-glucosidase inhibitor (n = 111). The majority of hypertensive patients (n = 662) used antihypertensive drugs such as calcium channel blockers, angiotensin II receptor blockers, diuretics, or beta blockers alone or in combination. Subjects with hyperlipidemia were treated with statins (n = 625), ezetimibe (n = 77), fibrates (n = 82), or omega-3 fatty acids (n = 41) alone or in combination (total n = 718). All patients were taught an appropriate diet proposed by the Japan Diabetes Foundation by a dietitian.
Diagnosis of diabetic complications
Diabetic retinopathy was diagnosed by the ophthalmologists. DKD is generally diagnosed by urinary albumin-creatinine ratio (UACR)>30 mg/g, and eGFR <60 mL/min/1.73 m2 [16]. However, eGFR is a central component of DKD and a strong confounder of SAF as well. For these reasons, a duration of diabetes of 5 years or more and the presence of diabetic retinopathy were added to UACR> 30 mg/g and eGFR < 60 mL/min / 1.73 m2 to eliminate non-diabetic kidney dysfunction. The ViNA cohort excluded patients undergoing dialysis. Coronary artery disease (CAD) such as myocardial infarction, stable angina, and unstable angina was diagnosed by a cardiologist. Peripheral artery disease (PAD) was simply diagnosed by ankle-brachial pressure index (ABI)≦0.9 17) in 764 subjects who were underwent ABI measurement. Stroke was diagnosed by a specialist in neurology or neurosurgery. This includes lacuna infarction, atherosclerotic thrombosis, cardiogenic thrombosis, and cerebral hemorrhage.
Measurements
SAF was measured non-invasively by placing the ventral site of the forearm on the AGE-Reader (Selista Inc. Tokyo)., and expressed arbitrary units (AU). The principle of this method was full described elsewhere 7). Theoretically, there is no difference between the left arm and the right arm, and simultaneous reproducibility has been reported to be within 5%. The ankle-brachial pressure index (ABI) was measured using a volume-plethysmographic apparatus (form PWV/ABI; OMRON Health Care, Co., Ltd., Kyoto, Japan). Serum samples were taken in the morning after overnight fasting. C-peptide was measured by the ELISA method. High sensitive (hs)-CRP, brain natriuretic peptide (BNP) and serum albumin were measured by commercially available test kits. Albumin in urine was corrected by urinary creatinine and represented as UACR. Visceral fat area (VFA) and subcutaneous fat area (SFA) were measured using CT scan (Fat scan program, Fujifilm, Tokyo) in 510 subjects who accepted fat mass measurements.
The study complied with the principal of the Declaration of Helsinki. The study was detailed to all subjects who consented to participate, and a written informed consent form was obtained from all participants prior to the study. This study was approved by the Ethics Committee of Ebina General Hospital (no115,2019).
Statistics.
Categorical variables were expressed as number and percentage of subjects or as mode and range. Continuous variables were expressed as mean ± standard deviation (SD) or as median with interquartile range (IQR). The p trend was estimated by Cochran-Armitage trend test for categorical variables or Jonckheere-Terpstra trend test for continuous variables. Jonckheere-Terpstra trend test was performed with EZR (Saitama Medical Center, Jichi Medical University, Saitama, Japan, version 1.54)18) Correlations between continuous variables were evaluated with Pearson’s simple correlation analysis, and correlations between categorical variables and continuous variables were evaluated by the logistic analysis. For non-normally distributed variables, logarithmic transformation was performed before linear regression. The relationship between each diabetic complication and SAF, age, duration of diabetes, or eGFR was determined by logistic analysis and expressed aχ2value. Multiple logistic analyzes were performed for diabetic complications as SAF, age, duration of diabetes, and eGFR were explanatory variables. Multivariate regression analyzes were performed for log-UACR, albumin, uric acids, BNP, and HbA1c as SAF, age, duration of diabetes, and eGFR were explanatory variables. P-value less than 0.05 was considered statistically significant. Analyses were performed using JMP software version 15 (SAS Institute, Cary, NC, USA).
III. Results
Figure 1 depicts the correlation between SAF and age, duration of diabetes, and eGFR. SAF was significantly correlated with these parameters. The correlation coefficient was similar for age and eGFR, but the correlation for the duration of diabetes was weaker than others
Table 1 shows the characteristics and measurements of subjects stratified by the SAF quartiles (Q1, Q2, Q3, and Q4). Mean value of SAF in total subjects (n = 1,130) was 2.36 AU (range, 1.2-4.6, SD = 0.49). Subjects with SAFs of 2.0 and 2.3 were classified as Q2, and 2.7 was as Q3 because several subjects had the same SAF values at the split points. Then, the numbers in the four groups were not equal. As the quartile increased, so did the age. The duration of diabetes was longer in Q2, Q3, and Q4 than in Q1. As the quartile increased, eGFR decreased significantly. The proportion of men increased slightly, and the body mass index (BMI) decreased as the quartile increased. Current smokers and habitual drinkers were similar between groups. The prevalence of CAD, stroke, diabetic retinopathy, and DKD in total subjects was 11, 8, 25, and 10%, respectively. The prevalence of CAD, stroke, diabetic retinopathy, and DKD increased with increasing quartiles. The prevalence of PAD, defined as having an ABI of equal or less than 0.9, increased with higher quartiles. The number of insulin and sulfonylurea users increased with the quartile. There was no significant difference in the number of use of oral anti-diabetes drugs (OAD) between the quartiles. The number of antihypertensive drugs was higher with the quartile. There was no significant difference in the number of statin users between the quartiles.
Table 2 shows the clinical measurements of subjects stratified by the SAF quartiles. VFA and SFA were not significantly changed among quartiles. Systolic blood pressure (SBP) was similar, but diastolic blood pressure (DBP) was lower with higher quartiles. As the quartile increased, UACR and uric acid increased, but serum albumin did not. High sensitivity (hs) -CRP was comparable, but white blood cells (WBC) and BNP increased with quartiles. As the quartile increased, ALT decreased but γGT did not. HbA1c increased with increasing quartiles, but C-peptide and glucose were comparable. Serum triglycerides, LDL-cholesterol (C), and HDL-C were comparable between the quartiles.
Table 3 shows the odds ratio (OR) and 95% confidence interval (CI) of the prevalence of major diabetic complications of SAF-Q2-4 with reference to Q1. In Q3 and Q4, the OR of diabetic retinopathy was 1.81 times and 2.27 times higher than in Q1, respectively. Q3 and Q4 showed 2.97 and 5.89 times higher OR of stroke than Q1, respectively. These trends remained the same after adjusting for age, duration of diabetes, and eGFR. The OR of DKD in Q4 was 2.65 times that of Q1. This trend remained the same after adjusting for age and duration of diabetes. The OR of CAD for Q4 was 2.24 times that for Q1, but after adjusting for age, duration of diabetes, and eGFR, this high OR was no longer significant. The OR of PAD in Q3 and Q4 was 9.51 and 10.4 times that of Q1, respectively, but these high ORs were not significant after adjusting for age, duration of diabetes, and eGFR.
Table 4 shows correlations of SAF, eGFR, age, or duration of diabetes with diabetic complications and clinical measurements. SAF, eGFR, age, and duration of diabetes were significantly correlated with each other. SAF was significantly associated with the prevalence of CAD, PAD, stroke, diabetic retinopathy, and DKD. eGFR was also associated with these diabetic complications. Age was associated with all diabetic complications except retinopathy. The duration of diabetes was associated with all diabetic complications except stroke. SAF was correlated with log-UACR, low serum albumin, uric acid, BNP, and HbA1c. Like SAF, eGFR showed a similar correlation with these variables. Age was correlated with UACR, low serum albumin, and BNP, but not with uric acid and HbA1c. The duration of diabetes was only correlated with low serum albumin and HbA1c. Multivariate analysis was performed after adjustment for age, diabetes duration, and eGFR. SAF maintained a significant association with retinopathy and stroke, but lost association with CAD and PAD. Since the diagnosis of DKD includes eGFR, eGFR was removed from the explanatory variables of DKD. SAF was significantly associated with the strictly defined DKD regardless of age or duration of diabetes. SAF maintained a significant correlation with UACR, low serum albumin, uric acid, BNP, and HbA1c regardless of age, duration of diabetes, and eGFR.
Table 5 shows the multivariate logistic analysis of SAF or HbA1c and diabetic complications. SAF was significantly associated with all diabetic complications, while HbA1c was associated only with CAD and diabetic retinopathy.
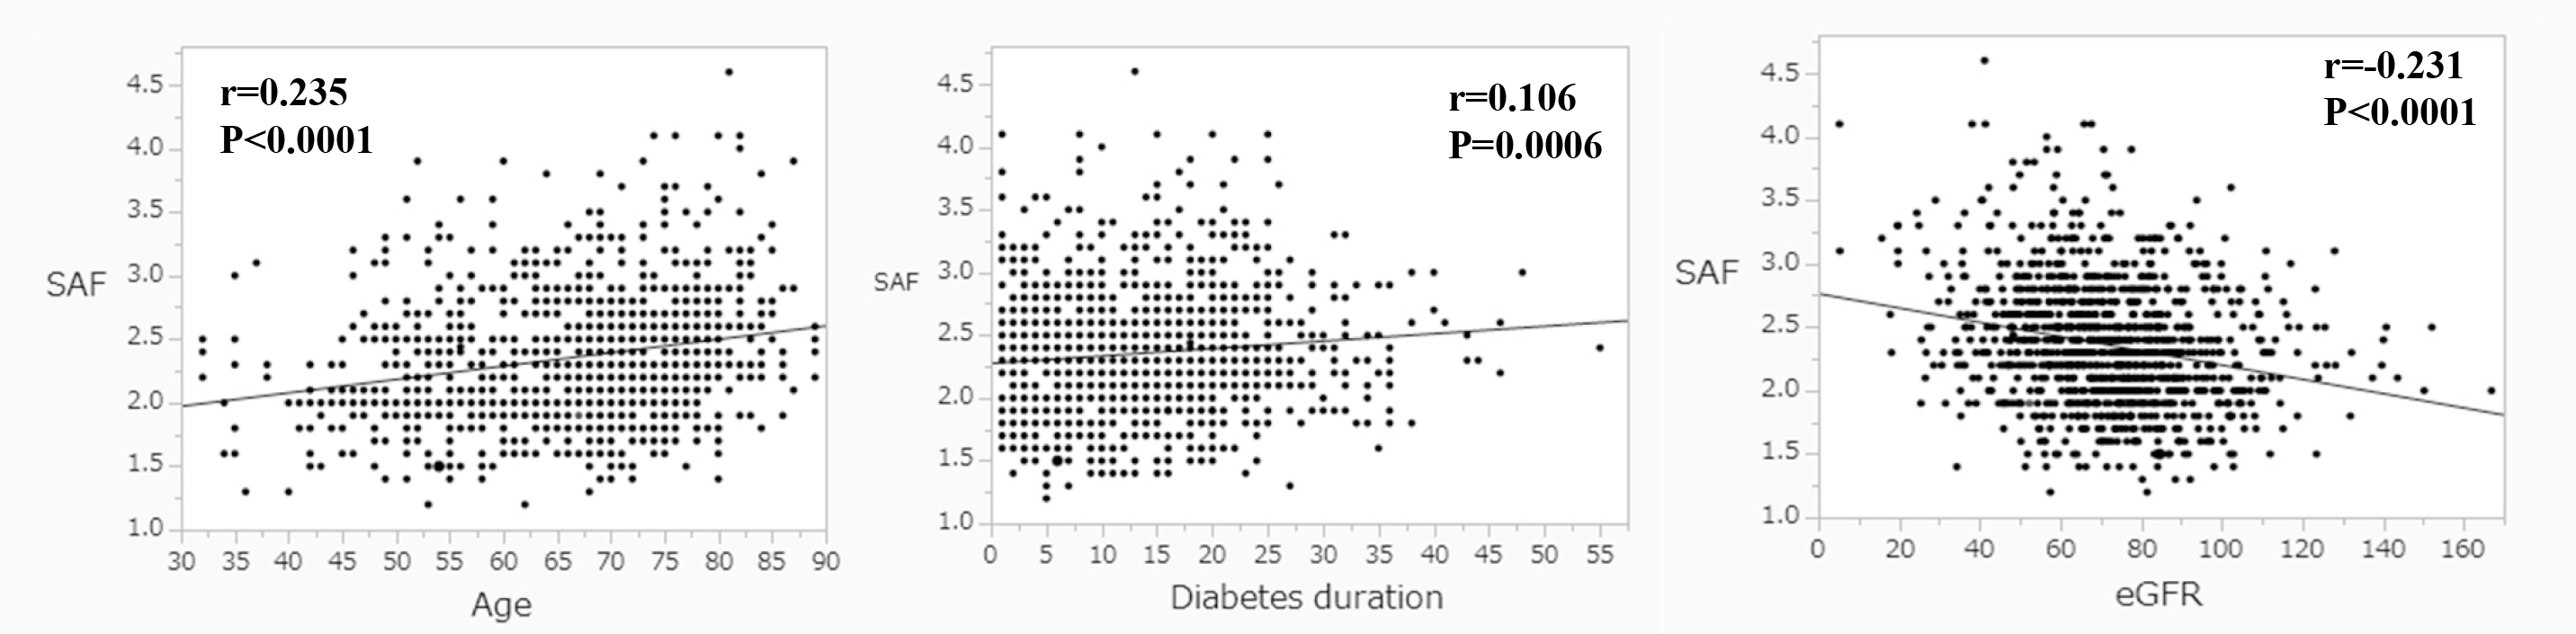
Figure 1 Correlations between skin autofluorescence (SAF) (arbitrary units), age (years), duration of diabetes (years), or eGFR (mL / min / 1.73 m2) in 1130 patients with type 2 diabetes. SAF = 1.6570217 + 0.0105198 ×Age, 2.2753903 + 0.0059212 ×Diabetes duration, and 2.7624938 – 0.0056147 × eGFR
Table 1 Clinical characteristics of subjects stratified by SAF quartil
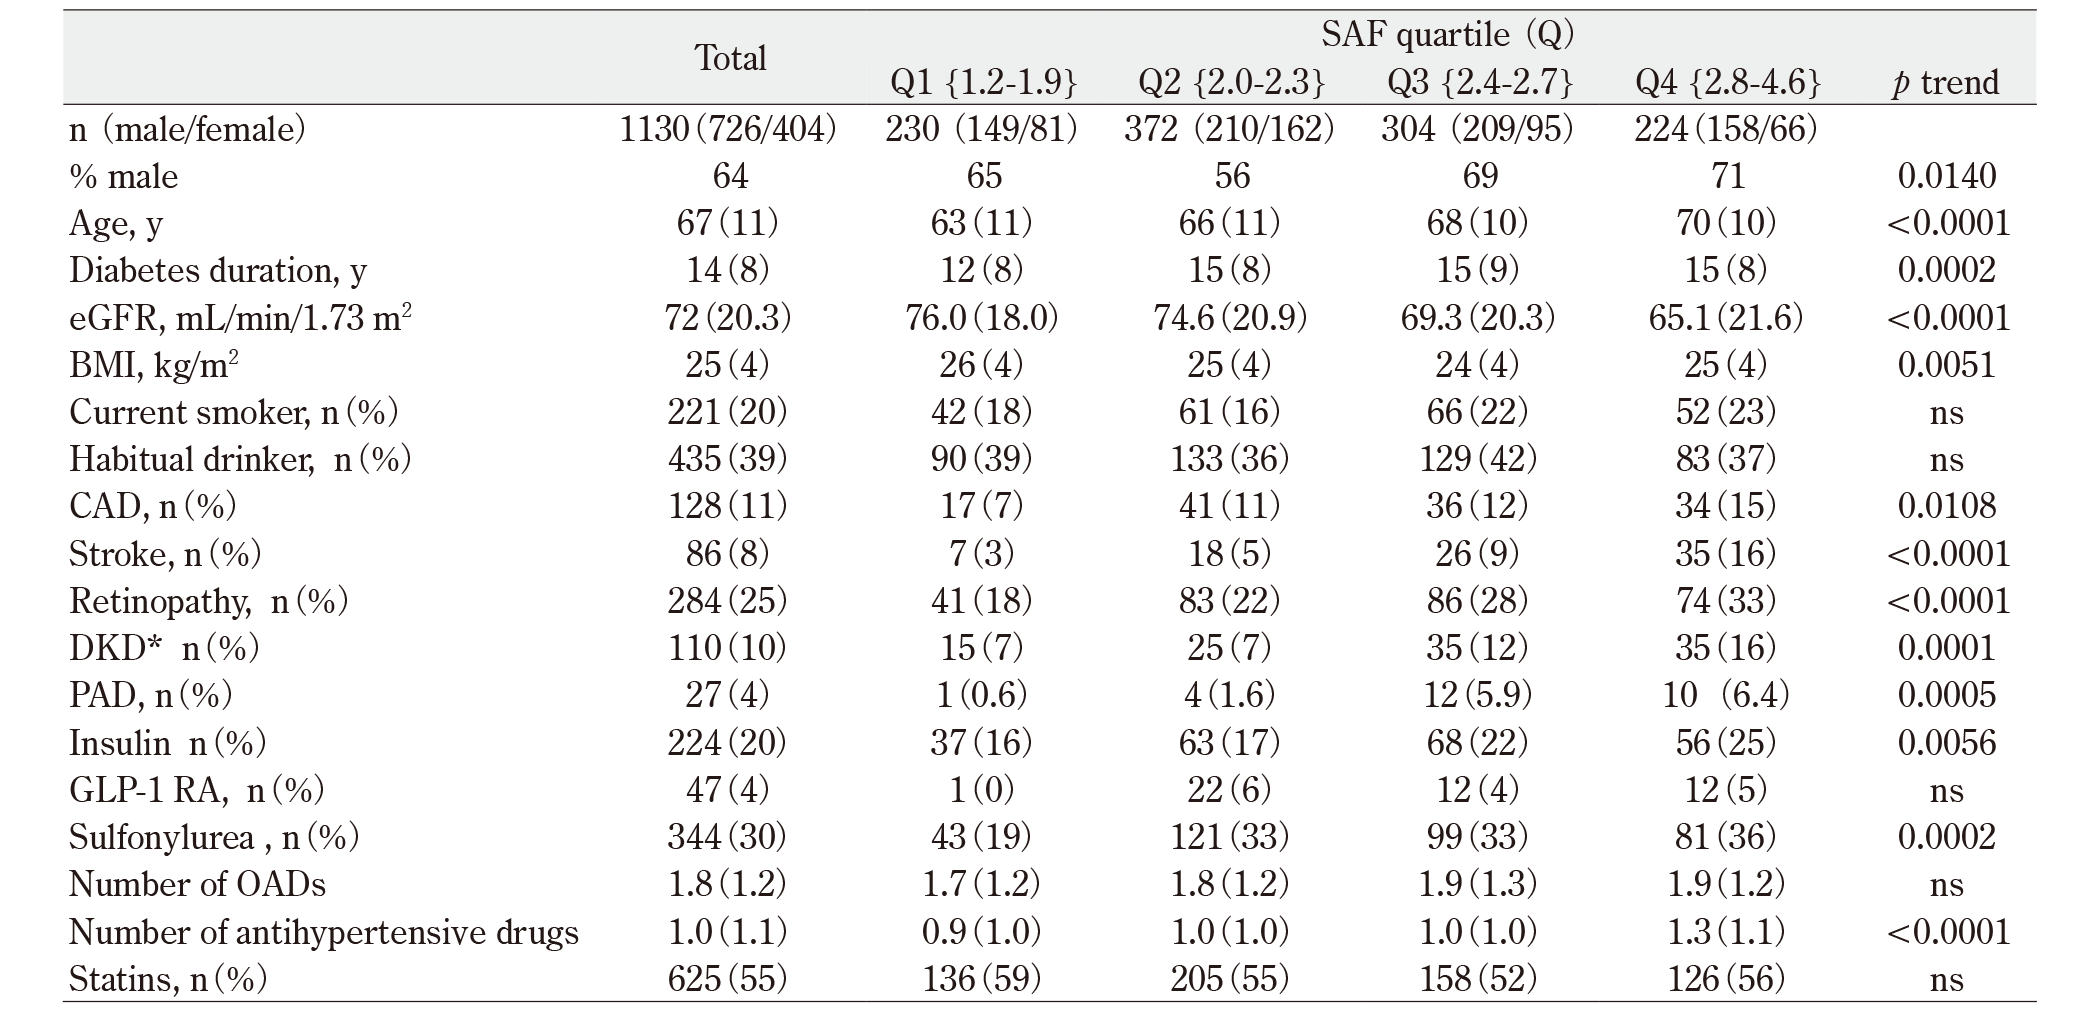
median [IQR] , n (%), mean (SD), or mode {range}, The p trend was estimated by Cochran-Armitage trend test for categorical variables or Jonckheere-Terpstra trend test for continuous variables.
Diabetic kidney disease (DKD)* is defined as eGFR<60, mico-or macroalbuminuria, presense of retinopathy, and the duration of diabetes over 5 years.
Peripheral artery disease (PAD) is diagnosed by ABI ≦ 0.9 in 764 subjects who were underwent ABI measurement.
SAF=skin autofluorescence, GLP-1RA=glucagon-like peptide-1 receptor agonists, SU=sulfonyluria, OAD=oral anti-diabetes drugs, ns=not significant
Table 2 Clinical measurements of subjects stratified by SAF quartile
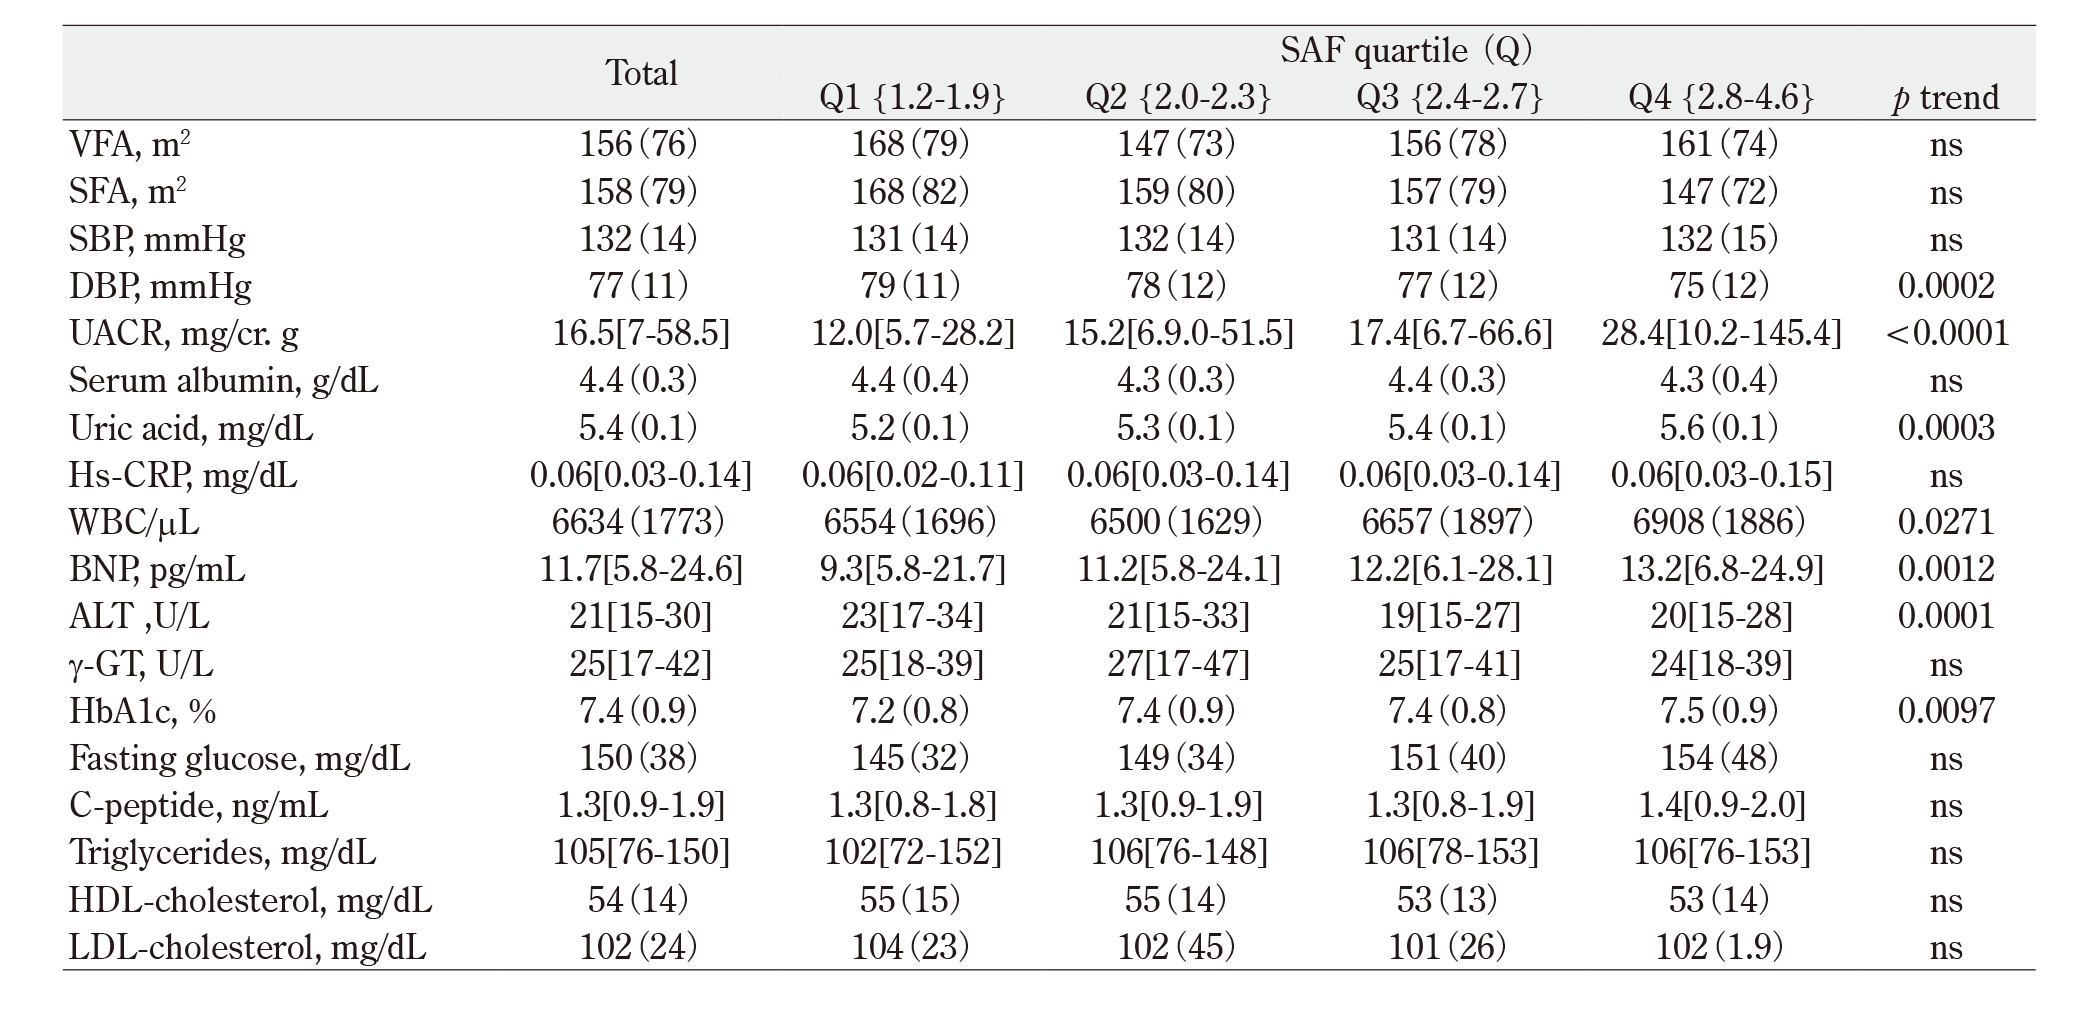
median [IQR], mean (SD), or mode {range}. The p trend was estimated by Cochran-Armitage trend test for categorical variables or Jonckheere-Terpstra trend test for continuous variables.
SBP=systric blood pressure, VFA=visceral fat area (n=510) , SFA=subctanous fat area (n=510), UACR=urinary albumin-creatinine ratio, BNP=brain natriuretic peptide, ALT=alanine amino transferase, WBC=white blood cell
Table 3 The odds ratio (OR) and 95% confidence interval (CI) of the prevalence of major diabetic complications
of SAF quartile (Q) 2,3, and4 with reference to Q1.
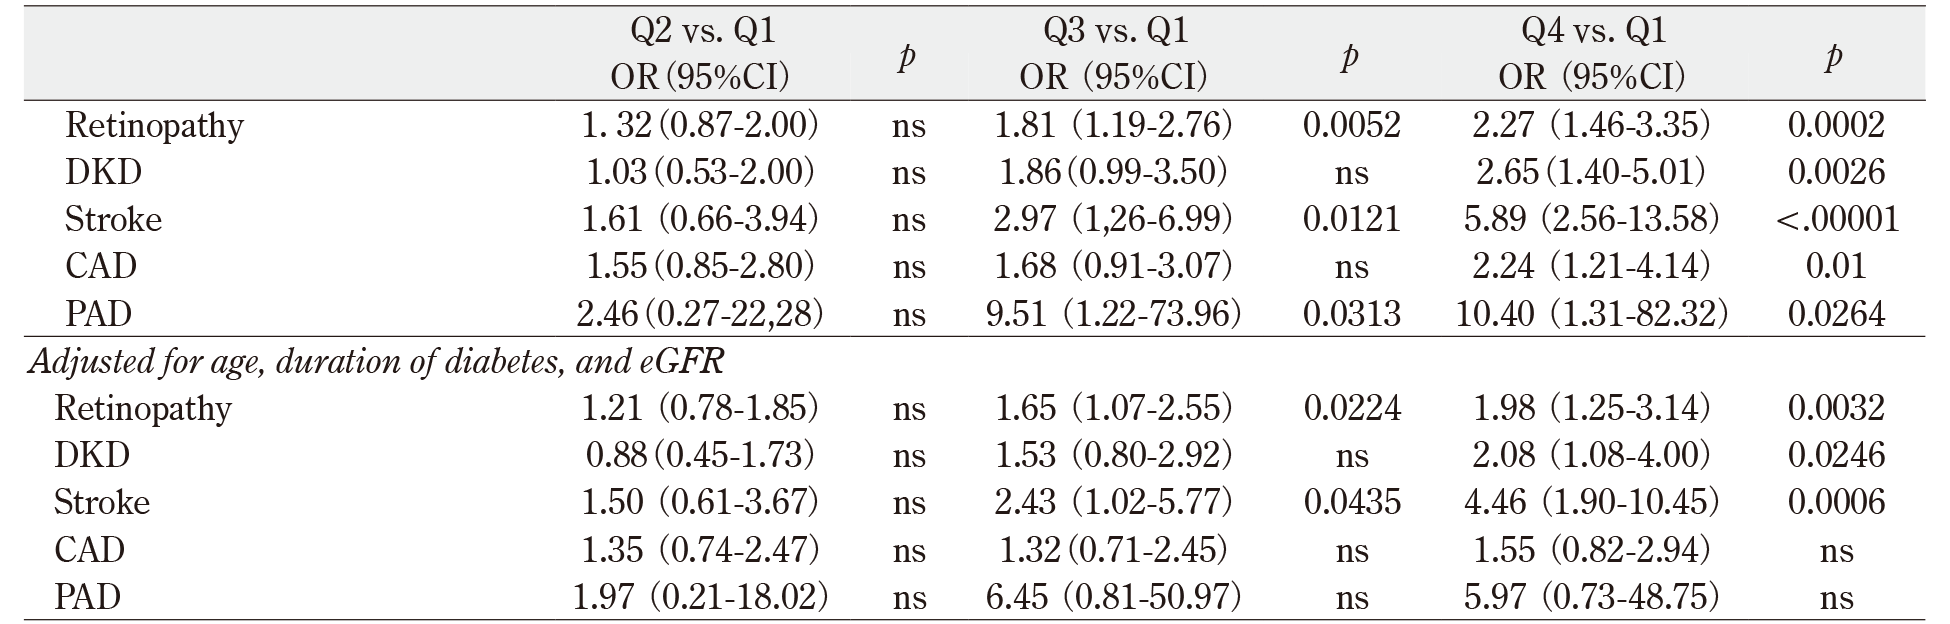
SAF=skin autofluorescence, DKD=diabetic kidney disease, CAD=coronary artery disease, PAD=peripheral artery disease. Peripheral artery disease (PAD) is diagnosed by ABI ≦ 0.9 in 764 subjects . ns=not significant
Table 4 Correlations of SAF, eGFR, age, or duration of diabetes with diabetic complications and clinical measurements
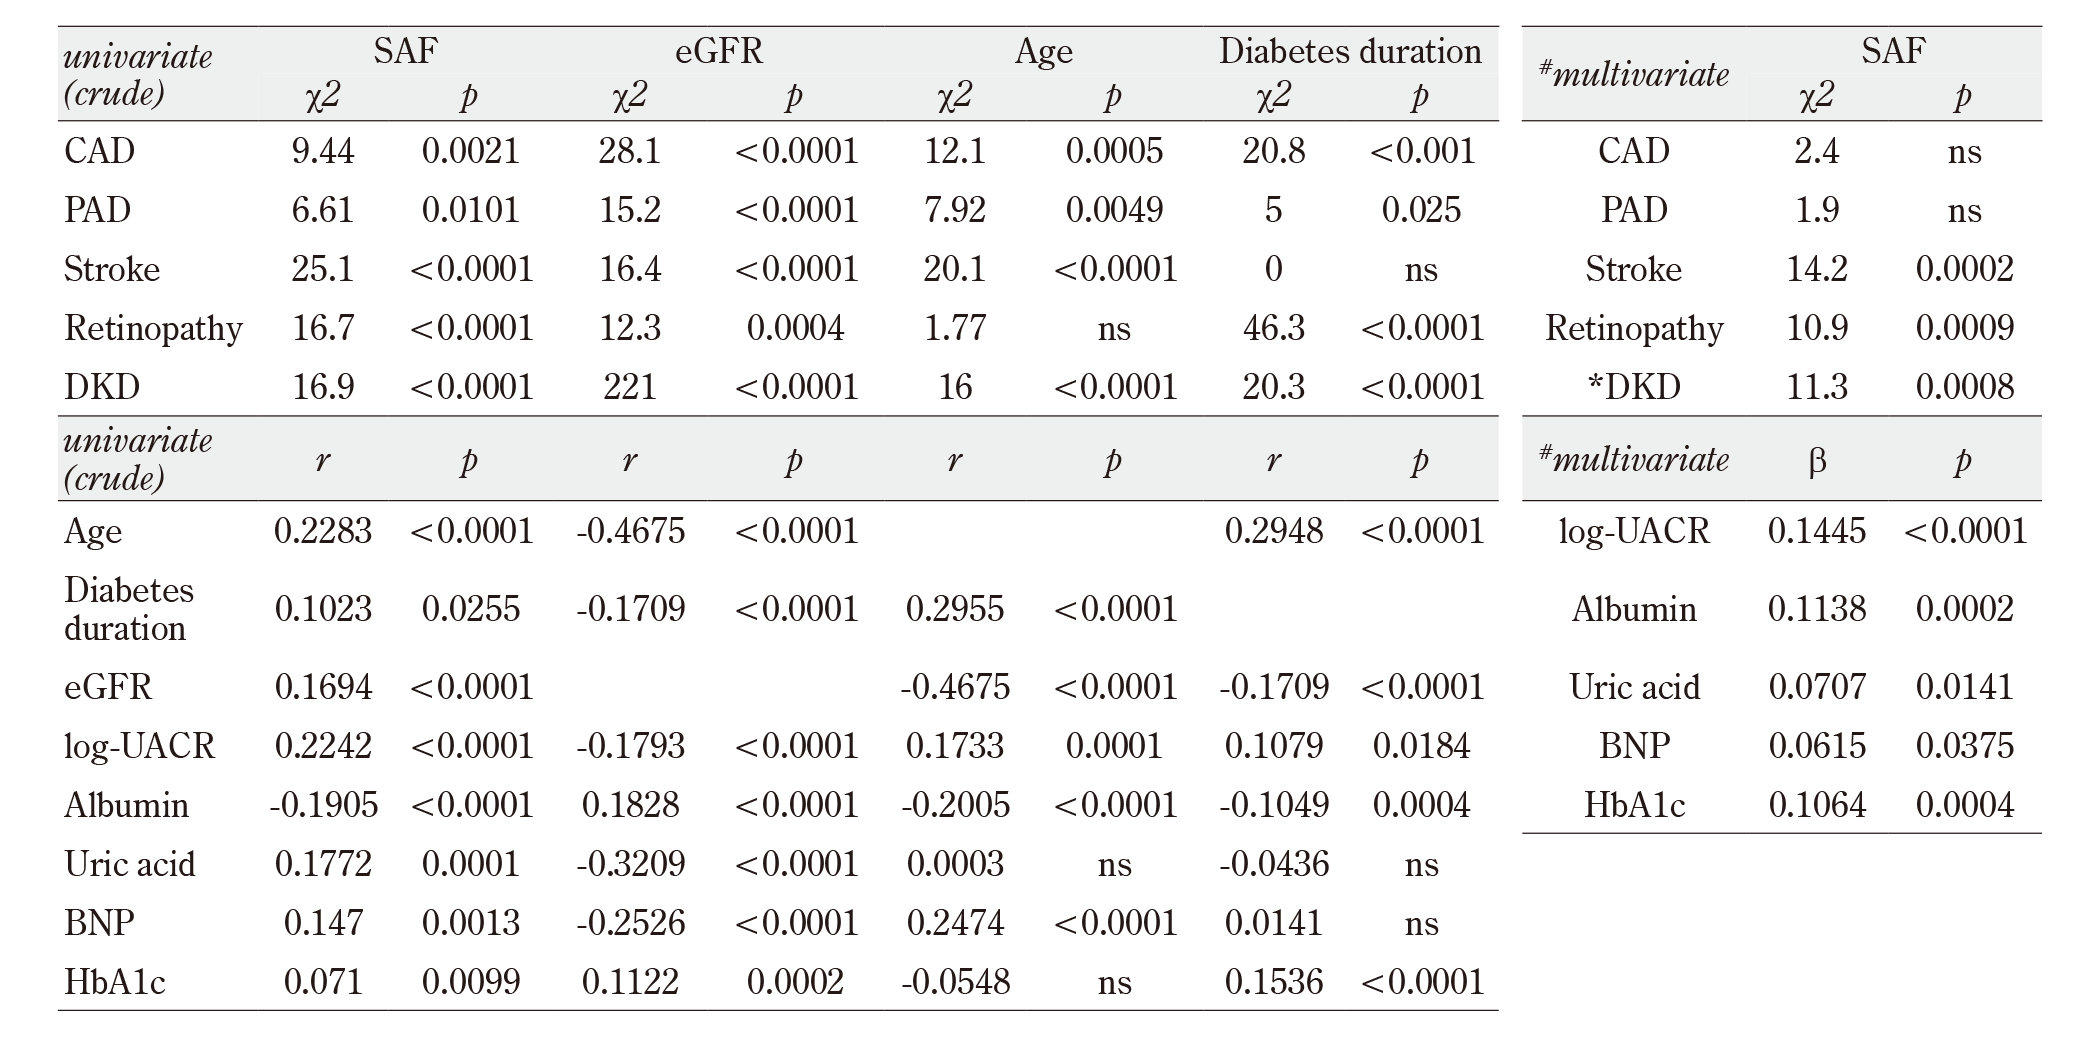
Correlations between continuous variables were evaluated with Pearson’s simple correlation analysis,
and correlations between categorical variables and continuous variables were evaluated by the logistic analysis.
SAF=skin autofluorescence, DKD=diabetic kidney disease, CAD=coronary artery disease, PAD=peripheral artery disease, UACR=urinary albumin-creatinine ratio, BNP=brain natriuretic peptide, ns=not significant Multivariate analysis was performed after adjustment for age, diabetes duration, and eGFR. adjusted for age and diabetes duration. β is a standard coefficient.
Table 5 Multivariate logistic analysis of SAF or HbA1c with diabetic complications
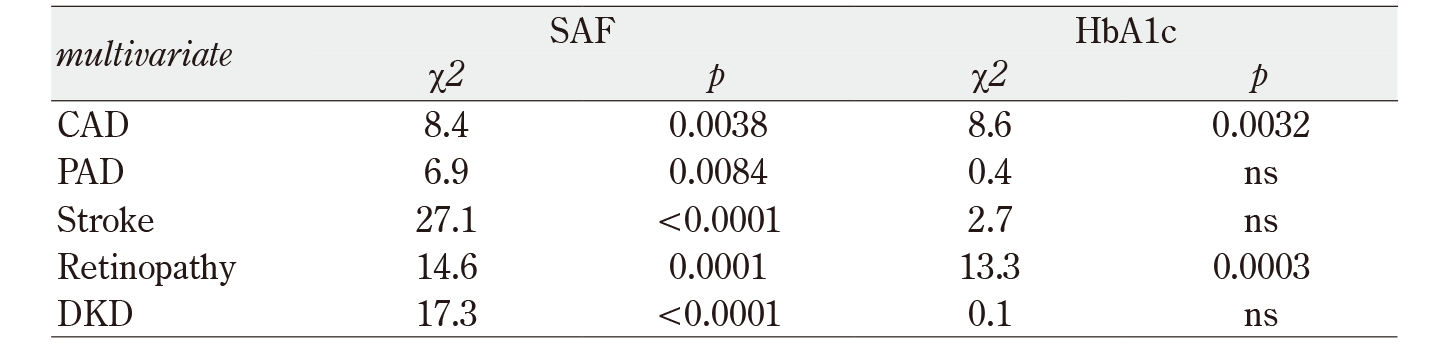
SAF and HbA1c are independent variables for each diabetic complications.
IV. Discussion
There are many cross-sectional studies 9)-11) and prospective studies 19)20) showing that SAF is associated with microvascular and macrovascular complications in subjects with type 2 diabetes. The current study is unique in that it examined the relationship between SAF and diabetic complications, taking into account eGFR and diabetes duration, which are particularly important but often ignored confounding factors. It is not surprising that the prevalence of diabetic complications is higher in patients with longer duration of diabetes, a lower renal function; therefore, the importance of SAF measurement can only be clarified beyond these factors. Wang et al 21) reported that SAF is an independent marker for diabetic retinopathy, DKD, cardiovascular disease, and diabetic peripheral neuropathy. Osawa et al 22) reported that SAF is significantly increased in patients with diabetic retinopathy, neuropathy, nephropathy, and macroangiopathy than in those without them, and significantly associated with the number of diabetic complications. Indeed, these studies employed eGFR and duration of diabetes as confounding factors. The major difference of the present study and these studies are definition of DKD and handling of macroangiopathy. These studies defined DKD in terms of eGFR and albuminuria, and thus include kidney dysfunction not attributable to diabetes. We included a history of long-term diabetes and diabetic retinopathy in the definition of DKD to exclude non-diabetic renal dysfunction. While these studies dealt with macroangiopathy as a whole, the present study examines the relationship between SAF and the prevalence of CAD, PAD, and stroke separately. It well recognized that SAF correlates with age, then some studies adopted age-corrected SAF values such as the SAFz score 20). However, the correlation between SAF and age is mild (r = 0.235), and the slope is very gentle (Figure 1). Therefore, uniform age correction may lead to an underestimation of the impact of SAF on outcomes, especially in the elderly.
Retinopathy is a typical diabetic complication and its onset is highly dependent on the duration and degree of hyperglycemia. Therefore, it is not surprising that patients with diabetic retinopathy have high levels of SAF as earlier studies have shown. Hence SAF would not be accepted as a good biomarker for retinopathy unless its association with retinopathy exceeds current glycemic control and the duration of diabetes. In addition, frequent coexistence of DKD might be primary cause for increase SAF in patients with retinopathy. Indeed, some reports have failed to demonstrate an association between SAF and diabetic retinopathy 19), suggesting that SAF does not fully represent glucose toxicity to the retina, or confounding factors unfairly weaken the association between diabetic retinopathy and SAF. SAF is significantly elevated in patients with end-stage kidney disease, regardless of diabetes 23). eGFR is a standard indicator of kidney function, a component of the diagnosis of DKD, and well known regulator of SAF. High SAF levels in DKD may merely be the result of defects in AGE removal through the kidney 24). Therefore, this study adopted a strict DKD definition including prolonged diabetes duration and the presence of diabetic retinopathy. Subjects who met this DKD definition had significantly higher SAF values, and SAF was significantly correlated with albuminuria independent of eGFR. These results suggest that SAF is causally associated with DKD beyond its impaired clearance.
We did not find an association between SAF and metabolic syndrome-related risk factors. This may in part explain why SAF is not significantly associated with CAD in the present study. PAD is another typical diabetic macroangiopathy. The current study used a simple definition of PAD, ABI ≦0.9. Therefore, the number of subjects undergoing ABI measurements was limited and some PAD patients may be excluded by this crude definition. Nevertheless, after adjusting for confounding factors, no close association was found between SAF and PAD. De Vos, et al 25) reported that SAF predicts amputation in patients with PAD. Therefore, SAF may be involved in the exacerbation of PAD, but its causal relationship with PAD remains unclear. Unlike CAD and PAD, SAF was closely associated with stroke, regardless of age, renal function, and duration of diabetes. It’s unclear why SAF is a good biomarker for stroke rather than CAD or PAD. A possible reason is that AGEs preferentially accumulate in small blood vessels over large ones. Because the cerebral arteries are much smaller than the coronary and femoral arteries, lipid-rich plaques could not fully develop into the thin vessel walls. This may relatively increase the pathological impact of AGE on vascular lesions compared to other cardiometabolic risk factors.
Conclusions
SAF is affected by age, duration of diabetes, and kidney function, and these confounding factors also affect diabetic complications. Therefore, careful analysis is required when assessing the clinical significance of SAF itself. Nevertheless, SAF was an excellent biomarker for diabetic retinopathy, strictly defined DKD, and stroke.
Acknowledgements
We would like to thank Mr. Noriyuki Satoh of Denka Co., Ltd. for his cooperation in statistical analysis, and Dr. Mitsuru Hosoya, Dr. Masahiro Fujita, Mrs. Mitsuko Soga, Mrs. Miyuki Tokudome, and Mrs. Yuko Yamamoto in Ebina General Hospital for their cooperation in this study.
Disclosures
No conflicts of interests.
References
- Rask-Madsen C, King GL. Vascular complications of diabetes: Mechanisms of injury and protective factors. Cell Metab 2013; 17(1): 20-33. PubMed
- Brownlee M. Biochemistry and molecular cell biology of diabetic complications. Nature 2001; 414(6865): 813-20. PubMed
- Yamagishi SI. Role of Advanced Glycation Endproduct (AGE)-Receptor for Advanced Glycation Endproduct (RAGE) Axis in Cardiovascular Disease and Its Therapeutic Intervention. Circ J 2019; 83(9): 1822-8. PubMed
- Nathan DM, Cleary PA, Backlund JY, et al. Diabetes Control and Complications Trial/Epidemiology of Diabetes Interventions and Complications (DCCT/EDIC) Study Research Group: Intensive diabetes treatment and cardiovascular disease in patients with type 1 diabetes. N Engl J Med 2005; 353(25): 2643-53.
- Holman RR, Paul SK, Bethel MA , et al. 10-year follow-up of intensive glucose control in type 2 diabetes. N Engl J Med 2008; 359(15): 1577-89. PubMed
- Monnier VM, Bautista O, Kenny D, et al. Skin collagen glycation, glycoxidation, and crosslinking are lower in subjects with long-term intensive versus conventional therapy of type 1 diabetes: relevance of glycated collagen products versus HbA1c as markers of diabetic complications. DCCT Skin Collagen Ancillary Study Group. Diabetes Control and Complications Trial. Diabetes 1999; 48(4): 870-80. PubMed
- Meerwaldt R, Graaff R, Oomen PHN, et al. Simple non-invasive assessment of advanced glycation endproduct accumulation. Diabetologia 2004; 47(7): 1324-30. PubMed
- Meerwaldt R, Hartog JW, Graaff R, et al. Skin autofluorescence, a measure of cumulative metabolic stress and advanced glycation end products, predicts mortality in hemodialysis patients. J Am Soc Nephrol 2005; 16(12): 3687-93. PubMed
- Tanaka K, Tani Y, Asai J, et al. Skin autofluorescence is associated with severity of vascular complications in Japanese patients with Type 2 diabetes. Diabet Med 2012;29:492-500. PubMed
- Rigo M, Lecocq M, Brouzeng C, et al. Skin autofluorescence, a marker of glucose memory in type 2 diabetes. Metabol Open 2020; 7: 100038. PubMed
- Fokkens BT, Smit AJ. Skin fluorescence as a clinical tool for non-invasive assessment of advanced glycation and long-term complications of diabetes. Glycoconj J 2016; 33: 527-35. PubMed
- Koetsier M, Lutgers HL, de Jonge C, et al. Reference values of skin autofluorescence. Diabetes Technol Ther 2010; 12(5): 399-403. PubMed
- Gerrits EG, Smit AJ, Bilo HJ. AGEs, autofluorescence and renal function. Nephrol Dial Transplant 2009; 24(3): 710-3. PubMed
- Foley RN, Parfrey PS, Sarnak MJ. Clinical epidemiology of cardiovascular disease in chronic renal disease. Am J Kidney Dis 1998, 32(5 Suppl 3); S112-9. PubMed
- Sugisawa E, Miura J, Iwamoto Y, et al. Skin autofluorescence reflects integration of past long-term glycemic control in patients with type 1 diabetes. Diabetes Care 2013; 36(8): 2339-45. PubMed
- National Kidney Foundation. KDOQI clinical practice guidelines and clinical practice recommendations or diabetes and chronic kidney disease. Am J Kidney Dis 2007; 49(2 Suppl 2): S12–S154. PubMed
- Firnhaber JM, Powell CS. Lower Extremity Peripheral Artery Disease: Diagnosis and Treatment. Am Fam Physician 2019; 99(6): 362-9. PubMed
- Kanda Y. Investigation of the freely-available easy-to-use software “EZR” (Easy R) for medical statistics. Bone Marrow Transplant 2013; 48(3): 452-8. PubMed
- Gerrits EG, Lutgers HL, Kleefstra N, et al. Skin autofluorescence: a tool to identify type 2 diabetic patients at risk for developing microvascular complications. Diabetes Care 2008; 31: 517-21. PubMed
- van Waateringe RP, Fokkens BT, Slagter SN, et al. Skin autofluorescence predicts incident type 2 diabetes, cardiovascular disease and mortality in the general population. Diabetologia. 2019; 62: 269-80. PubMed
- Wang X, Zhao X, Lian T, et al. Skin autofluorescence and the complexity of complications in patients with type 2 diabetes mellitus: a cross-sectional study. BMC Endocr Disord 2021; 21(1): 58. PubMed
- Osawa S, Katakami N, Sato I, et al. Skin autofluorescence is associated with vascular complications in patients with type 2 diabetes. J Diabetes Complications 2018; 32(9): 839-44. PubMed
- Arsov S, Graaff R, van Oeveren W, et al. Advanced glycation end-products and skin autofluorescence in end-stage renal disease: a review. Clin Chem Lab Med 2014; 52(1): 11-20. PubMed
- Willemsen S, Hartog JW, Heiner-Fokkema MR, et al. Advanced glycation end-products, a pathophysiological pathway in the cardiorenal syndrome. Heart Fail Rev 2012; 17(2): 221-8. PubMed
- de Vos LC, Boersema J, Mulder DJ, et al. Skin autofluorescence as a measure of advanced glycation end products deposition predicts 5-year amputation in patients with peripheral artery disease. Arterioscler Thromb Vasc Biol 2015; 35(6): 1532-7. PubMed