Hiroe Nagaike*1, Toshiyuki Hayashi*1,2, Yasuki Ito*3, Tsutomu Hirano*1,4
Cite
Nagaike N, Hayashi T, Ito Y, Hirano T. Association of pre-heparin plasma hepatic triglyceride lipase with lipoprotein subspecies in type 2 diabetes, Comparison with lipoprotein lipase. LMI articles, 2022; 1(1): 6-12. doi: 10.51041/lmi.1.1_6
Original
Lab Med Int 2022; 1(1): 6-12
Correspondence: Diabetes Center, Ebina General Hospital, Kawaharaguchi 1320 Ebina City, Kanagawa, Japan.
E-mail: hirano”@”med.showa-u.ac.jp
Received May 25, 2021; accepted July 8, 2021
*1 Department of Medicine, Division of Diabetes, Metabolism, and Endocrinology, Showa University School of Medicine.
*2 Yurakubashi Clinic
*3 R&D Department, Denka Co., Ltd.
*4 Diabetes Center, Ebina General Hospital
ABSTRACT
Aims: Hepatic triglyceride lipase (HTGL) is an essential enzyme for all lipoprotein metabolism. Recently, a sensitive assay kit for measuring HTGL protein in plasma without using heparin injection (pre-heparin) have become available. We investigated the association between pre-heparin HTGL and lipoprotein subspecies and compared it with lipoprotein lipase (LPL) to explore the clinical relevance of measurements in type 2 diabetes.
Methods: Fasting plasma were obtained from 120 patients with type 2 diabetes. HTGL and LPL concentrations were measured by their respective sandwich ELISA kits. Small dense low-density lipoprotein LDL-cholesterol (sdLDL-C), LDL-triglyceride (TG), and high-density lipoprotein (HDL)3-C was measured using the homogenous methods established by us. HDL2-C was calculated by subtracting HDL3-C from HDL-C. Visceral fat area (VFA) was measured by CT scan.
Results: Concentrations of HTGL and LPL were identical; median (interquartile range) were 57(44-74) and 57 (44-70) ng/mL, respectively, and showed a skewed distribution. Gender, age, VFA, and glucose control were not associated with HTGL levels. The higher quartile of HTGL correlated with the higher LDL-C, lower LDL-TG/LDL-C and lower LDL-TG/apolipoprotein B implying TG-depletion of LDL. There were no significant associations of HTGL with remnant-like particle(RLP)-C or subspecies of LDL-C and HDL-C. Pre-heparin LPL inversely correlated with VFA, TG, RLP-C, LDL-TG, and sdLDL-C/LDL-C, and positively correlated with HDL-C and HDL2-C.
Conclusions: Pre-heparin HTGL was only associated with TG-depletion of LDL but not with major lipoprotein subspecies. Pre-heparin HTGL measurements may have limited clinical relevance compared to LPL in diabetic populations.
〔Lab Med Int 2022; 1(1): 6-12〕
Key Words
pre-heparin plasma, hepatic triglyceride lipase, lipoprotein lipase, type 2 diabetes, low-density lipoprotein subspecies
I. Introduction
HTGL is a serine hydrolase with highest specificity for lipoprotein triglyceride (TG) and phospholipid 1). HTGL is synthesized in the liver and released into plasma by heparin injection, similar to lipoprotein lipase (LPL) 1). HTGL activity can be measured in post-heparin plasma (PHP) when LPL is inactivated with protamine, NaCl or an LPL-specific antibody 1)2). Although many researchers have long recognized the importance of HTGL, the need for heparin injection has prevented the measurement of HTGL from being used in general clinical practice. For this reason, attempts have been made to measure lipolytic activities of HTGL and LPL in plasma without using heparin injection (pre-heparin) 3)–5). However, these enzymes exist in pre-heparin plasma as inactive form, thus it was difficult to measure these activities precisely. Recently the ELISA system for measurement of HTGL protein was frequently used instead of measurement of its activity 6)–8). It has been reported that pre-heparin HTGL highly correlated with PHP-HTGL 8).
HTGL plays an important role in the remodeling of LDL and HDL particles 1). HTGL is inversely related to the buoyancy and size of both LDL and HDL particles. Increased HTGL is associated with smaller and denser LDL (sdLDL) and HDL (HDL3) particles, while decreased HTGL is associated with larger and more buoyant LDL (lbLDL) and HDL (HDL2) particles 9). So far it remains to be determined the association of pre-heparin HTGL with LDL and HDL subspecies which has been already examined in PHP-HTGL 10). Patients with type 2 diabetes often have high levels remnant lipoproteins, sdLDL and low-HDL2-C 11), which are all be regulated by the action of HTGL. Therefore, diabetes is a good model for studying pre-heparin HTGL and its association with dyslipidemia.
Lipoprotein lipase (LPL) plays a central role in TG-rich lipoprotein metabolism by the lipolysis of TG and the uptake of these particles into the liver 12). The catalytically inactive form of LPL can be detected at fairly high levels in pre-heparin plasma 13). The LPL protein concentration was measurable using a sandwich enzyme immunoassay system 14). Although the clinical importance of measuring pre-heparin LPL protein is well documented 15)16), little is known about pre-heparin HTGL. We investigated the association between pre-heparin HTGL and lipoprotein subspecies and compared it with lipoprotein lipase (LPL) to explore clinical relevance of measurement of pre-heparin HTGL in type 2 diabetes.
II. Methods
A. Subjects
The subjects are 120 patients (99 male and 21 female) with type 2 diabetes who were outpatients at Showa University Hospital. Characteristics of diabetic subjects were listed in Table 1. Age was 61± 10, and body mass index was 26.7± 4.3 (mean± SD). Twenty-eight (24%) patients were insulin users , and seven patients were treated with glucagon-like peptide-1 receptor agonist (GLP-1RA). Most patients (n = 105) were treated with the following oral anti-diabetes drugs (OADs) alone or in combination: a sulfonylurea, metformin, pioglitazone, dipeptidylpeptidase-4 inhibitor, sodium-glucose cotransporter-2 inhibitor, or α-glucosidase inhibitor. Subjects with hyperlipidemia were treated with statins (n= 53), fibrates (n = 13), ezetimibe (n = 6), or omega-3 fatty acids (n = 14) alone or in combination. The majority of hypertensive patients used anti-hypertensive drugs; angiotensin-I converting enzyme (ACEi) or angiotensin II receptor blockers (ARB) (n = 75), calcium channel blockers (CCB) (n = 53), and diuretics (n = 3), alone or in combination. Ten subjects had history of coronary artery disease, 29 subjects had diabetic retinopathy, and 17 subjects had diabetic nephropathy. In preliminary, HTGL concentrations were measured in 17 (9 male and 8 female) healthy volunteers at age of 37± 9 for the comparison with diabetics. They never have been diagnosed with diabetes or any other chronic illness.
Pre-heparin plasma samples were taken in the morning after overnight fasting. HTGL protein was measured by the sandwich ELISA (Human HTGL Assay Kit-IBL, Takasaki, Gumma, Japan)8). The assay coefficients of variation were 4.2–7.1% for pre-heparin plasma, and 2.2–4.9% for PHP 8). LPL protein was measured by the sandwich ELISA 17). LDL-TG, sdLDL-C, and HD3-C concentrations were measured directly in plasma by the homogeneous methods established by our group 18)–20). LbLDL-C was calculated by subtracting sdLDL-C from LDL-C, nonHDL-C was calculated by subtracting HDL-C from total-C (TC). HDL2-C was calculated by subtracting HDL3-C from HDL-C. Estimated glomerular filtration rate (eGFR) was calculated from calibrated serum creatinine using the Chronic Kidney Disease Epidemiology Collaboration equation. The albuminuric stage was assessed by the urinary albumin-to-creatinine ratio (UACR) in spot-urine samples. Apolipoproteins were measured by immuno-terbidimetric assay. Apolipoprotein data was missing in 2 patients.
Visceral fat area (VFA) and subcutaneous fat area (SFA) was measured by CT scan. CT data was available in 98 patients. The study was detailed to all subjects including the volunteers who consented to participate, and a written informed consent form was obtained from all participants prior to the study. This study was approved by the Ethics Committee of Showa University Hospital.
B. Statistics
All continuous variables were expressed as mean± standard deviation (SD). Differences between groups were examined with either Student’s t-test or ANOVA. The p trend was estimated by Jonckheere-Terpstra trend test. Correlations between variables were evaluated with Pearson’s simple linear regression analysis. HTGL, LPL, TG, and UACR showed a skewed distribution. Therefore, log-transformed values were adopted for the linear regression analysis. P-value less than 0.05 was considered statistically significant. Analyses were performed using JMP software version 15 (SAS Institute, Cary, NC, USA).
III. Results
Figure 1
depicts the distribution of HTGL and LPL in 120 patients with type 2 diabetes. Concentrations of HTGL and LPL were identical, and median values (interquartile range) were 57(44-74) and 57 (44-70) ng/mL, respectively. These showed a skewed distribution. Therefore, the log-transformed HTGL or LPL were adopted for subsequent linear regression analysis. In a preliminary study, the HTGL concentration of 17 healthy volunteers was 44.2 ± 16.7 ng / mL, significantly lower than that of diabetics (p <0.05).
Table 1
shows the characteristics of the subjects and the measurements stratified by the HTGL quartile (Q). Overall, the average BMI was greater 25.0 and the visceral fat area (VFA) was over 100 cm2, indicating visceral fat obesity. Patients with liver and kidney dysfunction were rare. Their blood pressure was well controlled, but their glycemic control was not fully controlled. TC, LDL-C, nonHDL-C, TG, and HDL-C levels in the majority of subjects were within normal limits, probably because most of them were treated with statins or other lipid-lowering agents. There were no significant differences in age, gender, blood pressure, body mass index, VFA, SFA, or glycemic control between quartiles. There were no significant differences in the use of antihypertensive, hypoglycemic, or lipid-lowering drugs between quartiles. AST and ALT tended to decrease with higher HTGL quartiles, and γ-GTP decreased with higher HTGL quartiles. LPL concentrations were similar between quartiles. TC, LDL-C, nonHDL-C, TG, and HDL-C levels were similar between quartiles. SdLDL-C, lbLDL-C, LDL-TG, HDL2-C, HDL3-C, apo AI, AII, B, CII, CIII, and E, and RLP-C are comparable between quartiles. The higher quartiles of HTGL significantly correlated with lower LDL-TG / LDL-C, or lower LDL-TG / apoB.
Figure 2
shows a simple regression analysis between log-HTGL or log-LPL and VFA or SVF (n = 98). Log-HTGL was not correlated with VFA or SFA, while Log-LPL was inversely correlated with VFA, but not with SFA.
Figure 3 shows a simple regression analysis between log-HTGL and LDL subspecies. Log-HTGL was positively correlated with LDL-C, but not with sdLDL-C or lbLDL-C. Log-HTGL did not correlate with LDL-TG, but inversely with LDL-TG / LDL-C or LDL-TG / apo B. HTGL did not correlate with TG, RLP-C, nonHDL-C, HDL-C, or HDL2,3-C (data not shown).
Figure 4 shows a simple regression analysis between log-LPL and various lipid parameters. Log-LPL was inversely correlated with log-TG, RLP-C, and LDL-TG, but not with LDL-C. Log-LPL was not correlated with sdLDL-C, but was inversely correlated with sdLDL-C / LDL-C. Log-LPL was correlated with HDL-C, HDL2-C, and apoAI, but not with HDL3-C. Log-LPL did not correlate with age, BMI, glycemic control, blood pressure, eGFR, log-UACR, nonHDL-C, LDL-TG / LDL-C, LDL-TG / apo B, apo AII, apoCIII, and apoE (data not shown).
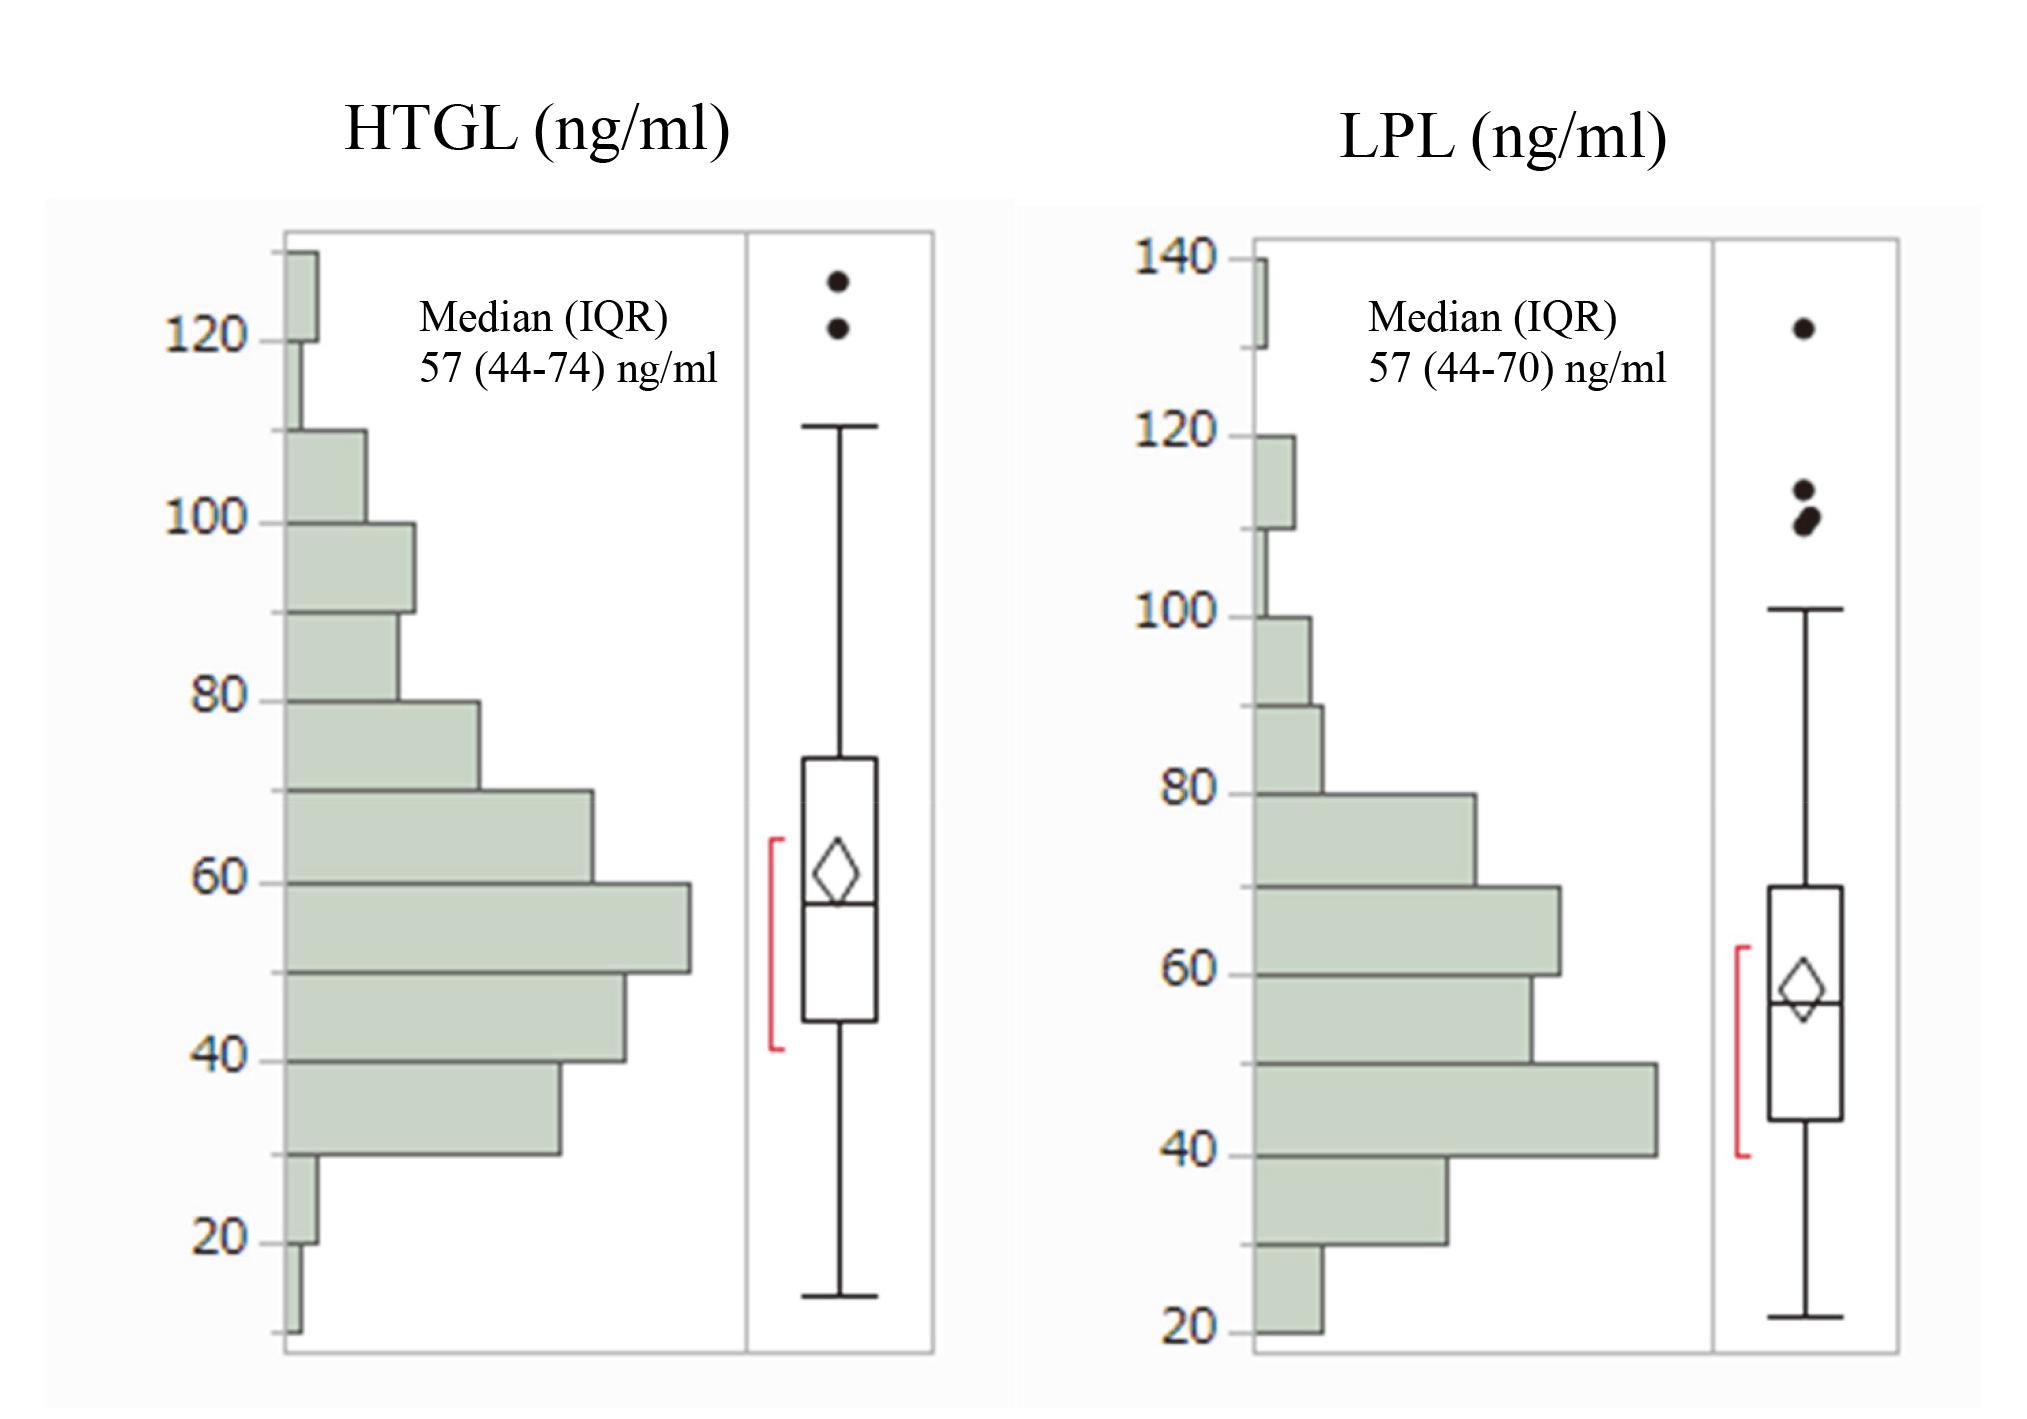
Figure 1 Distribution of hepatic triglyceride lipase (HGL) and lipoprotein lipase (LPL)
in pre-heparin plasmas of 120 type2 diabetic patients.
Table 1 Various measurements stratified by quartile of hepatic triglyceride lipase (HTGL) concentration in patients with type 2 diabetes.
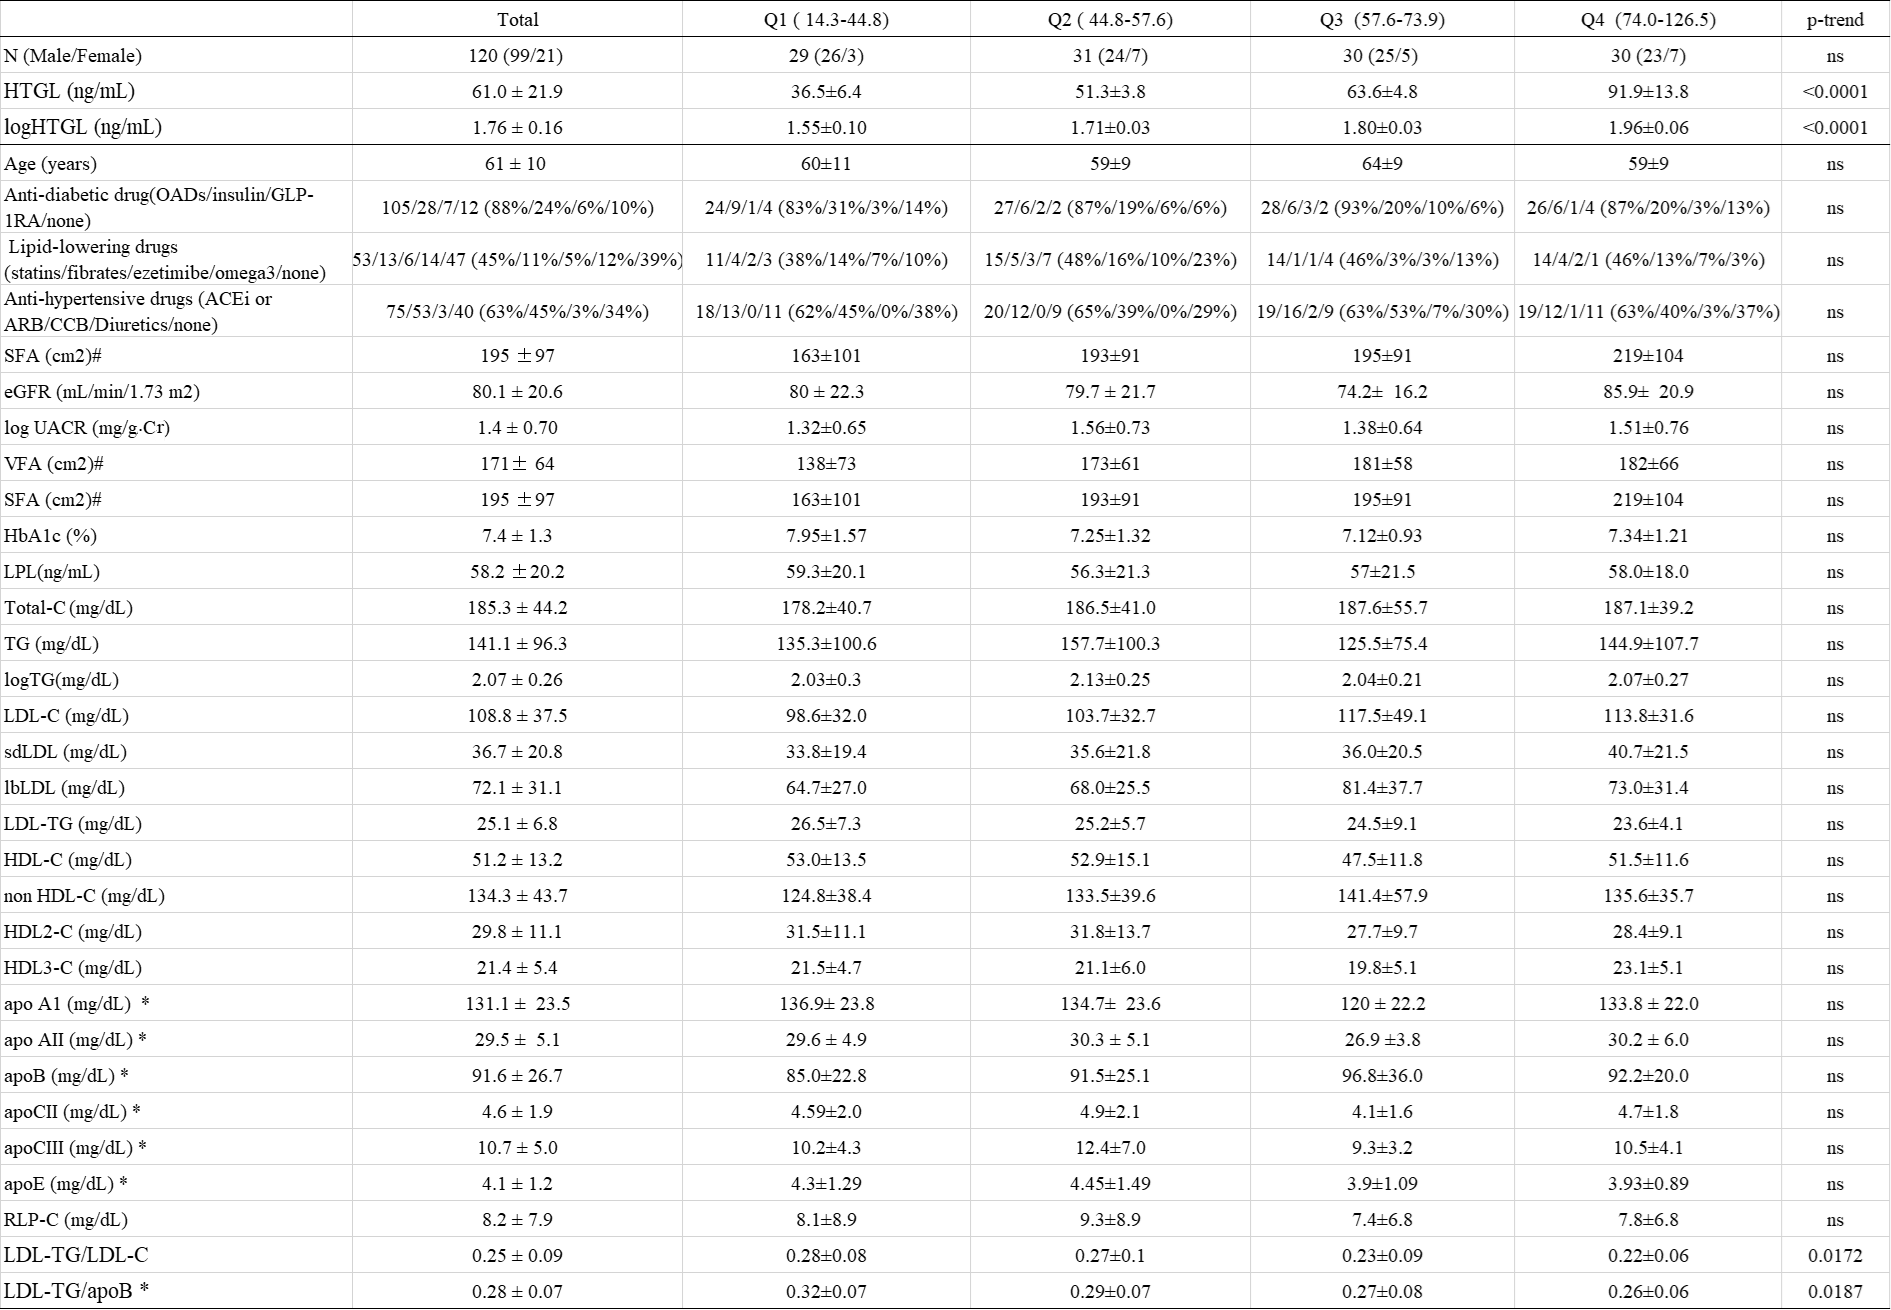
n = 98, *n = 118. Values are mean±SD. The p trend was estimated by Jonckheere-Terpstra trend test . ns = not significance
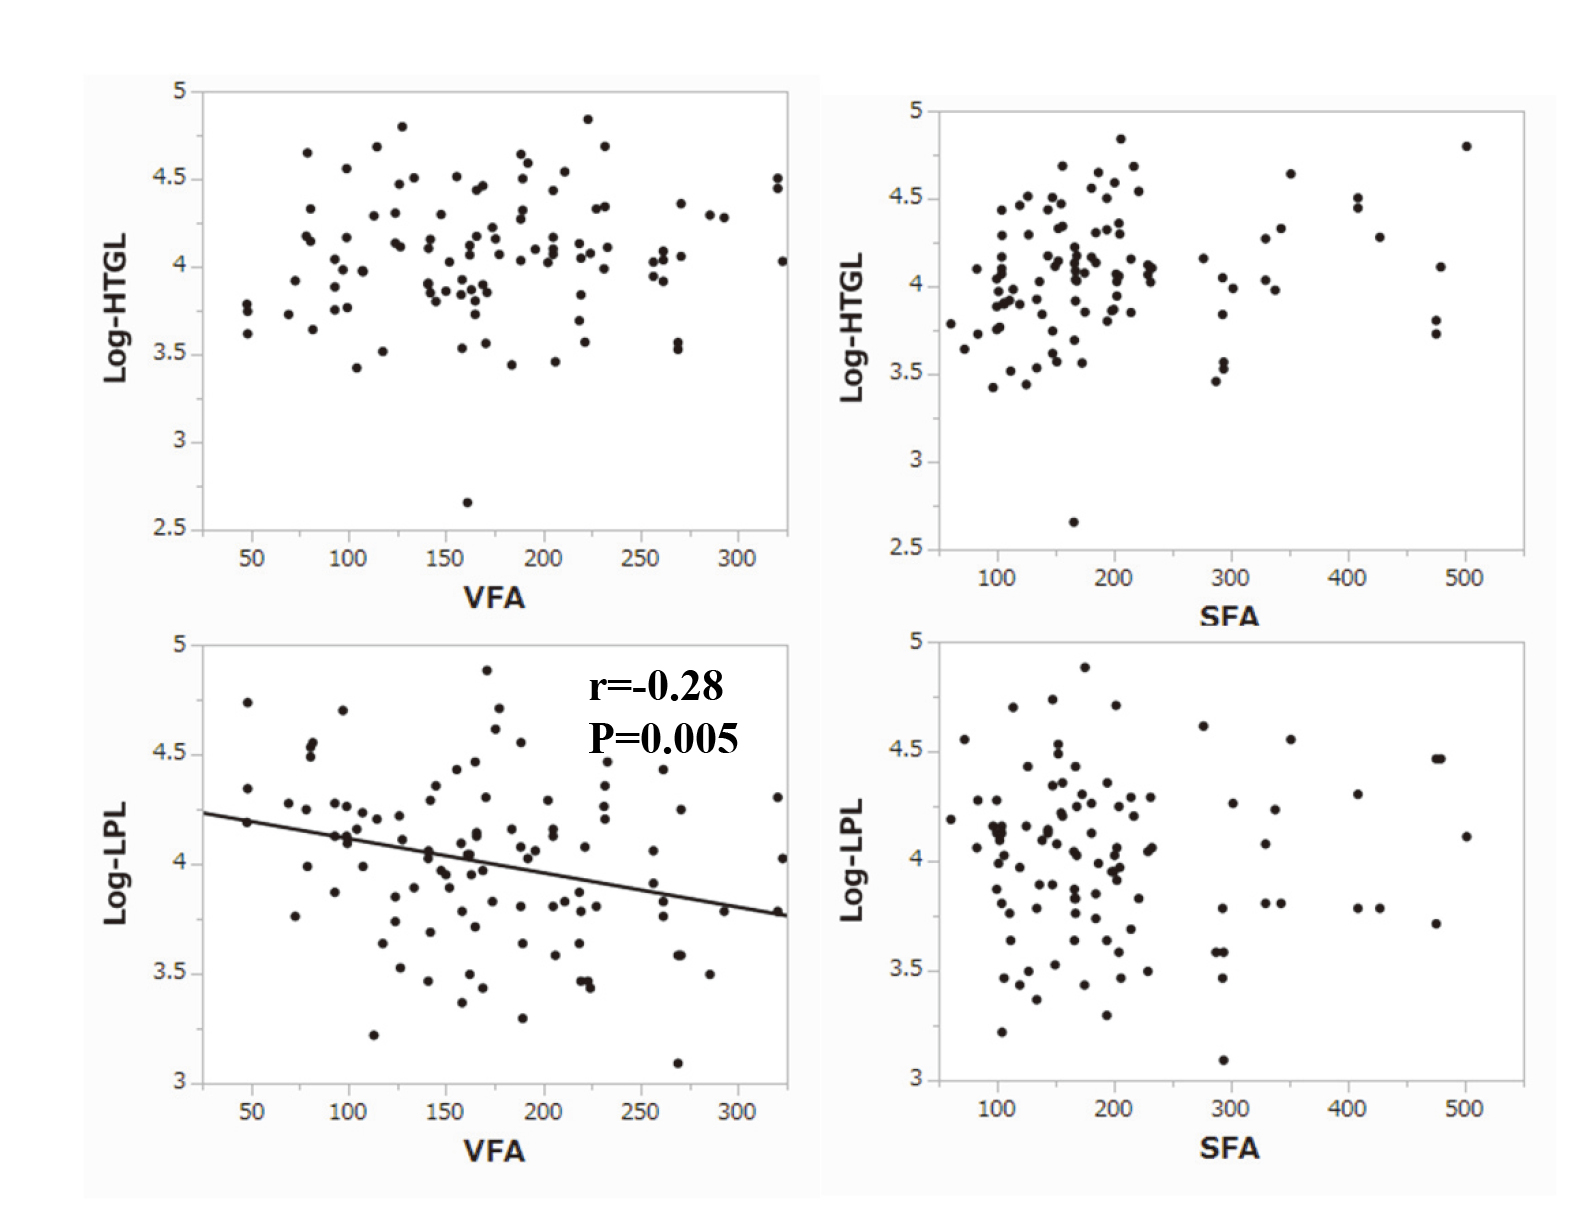
Figure 2 Relationship between log-HTGL or log-LPL and visceral fat area (VFA)
or subcutaneous fat are (SFA) in 98 type 2 diabetic patients.
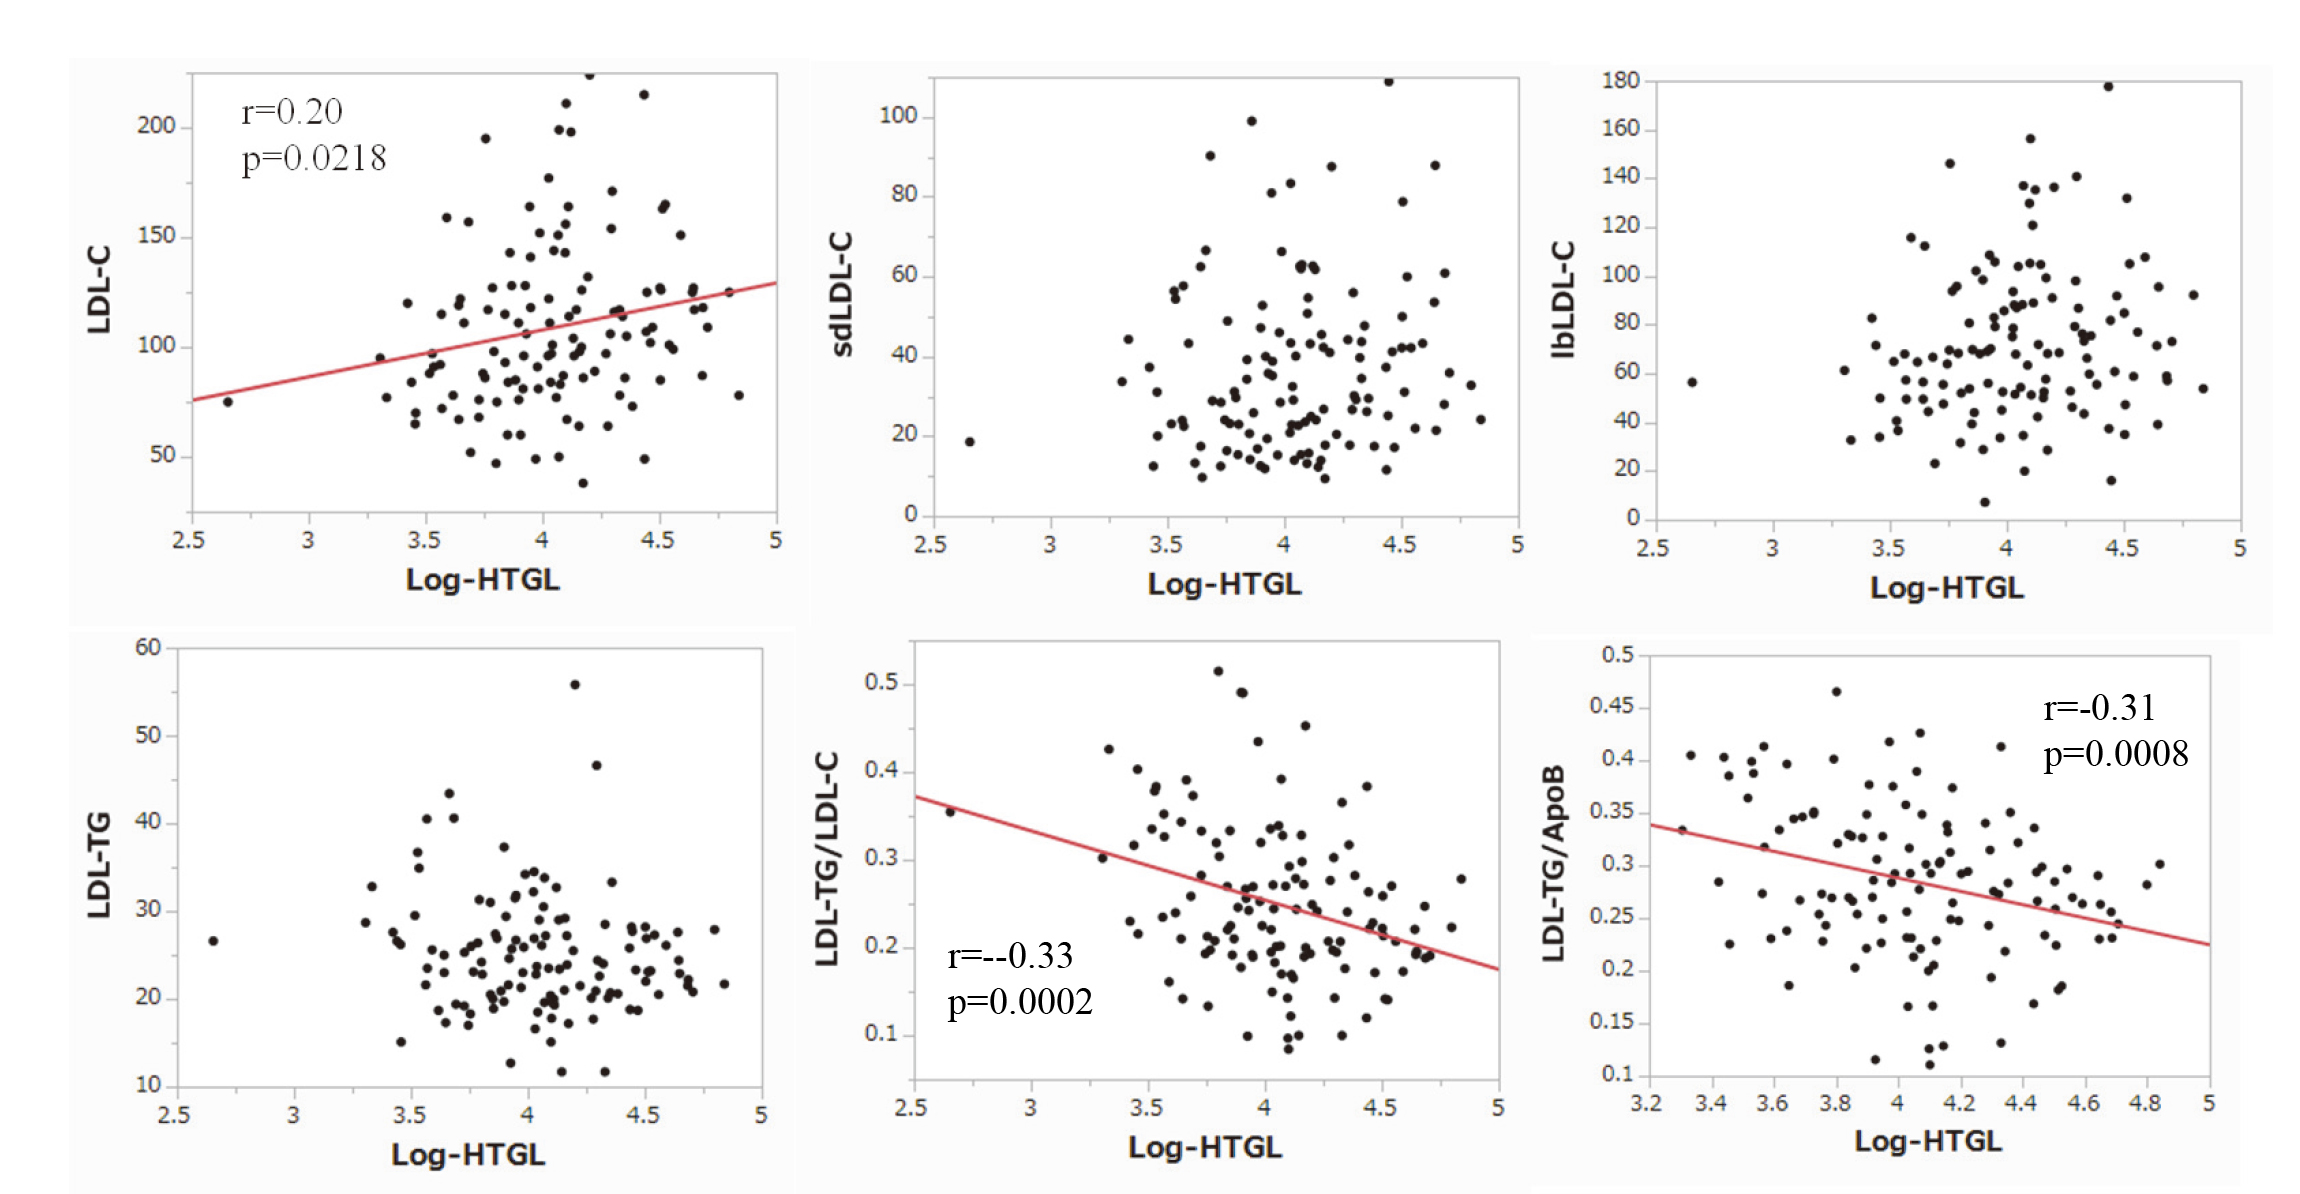
Figure 3 Relationship between log-HTGL and LDL subspecies in type diabetic patients.
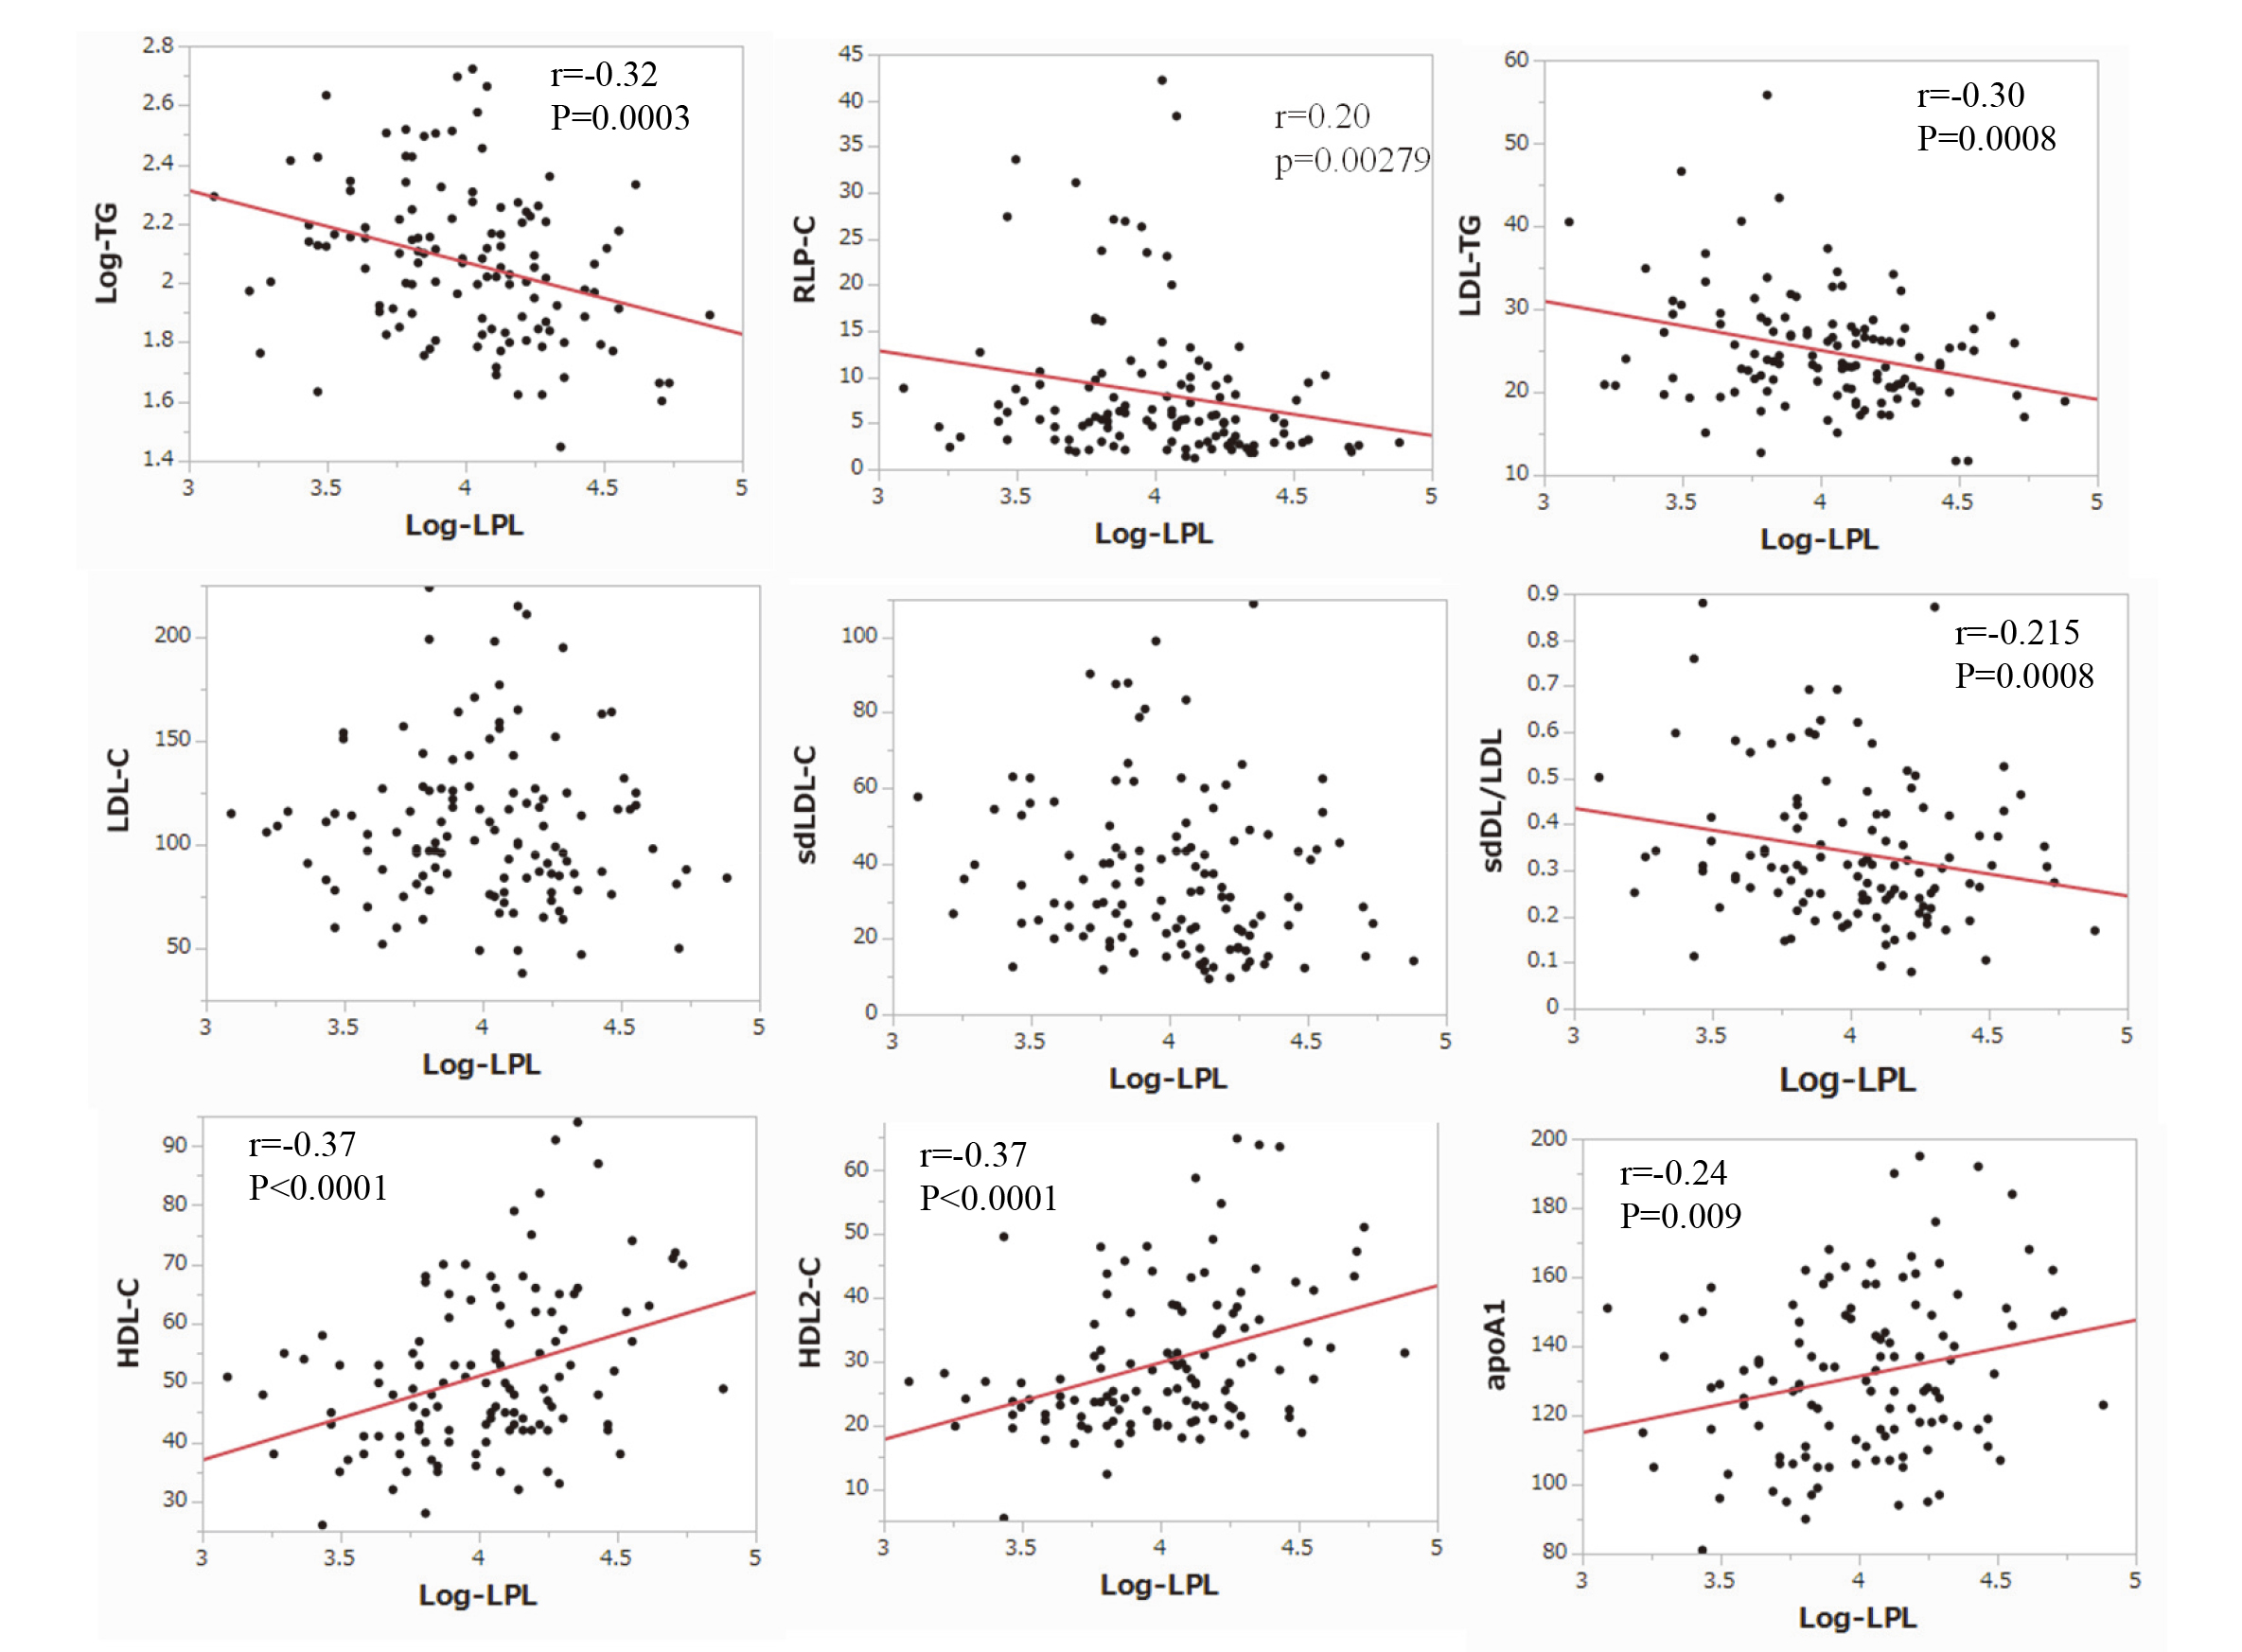
Figure 4 Relationship between log-LPL and various lipid parameters in type diabetic patients.
IV. Discussion
We investigated the association between pre-heparin HTGL protein concentration and conventional and novel lipid parameters in patients with type 2 diabetes. Our study is the first to show pre-heparin HTGL levels in type 2 diabetes and their association with LDL and HDL subspecies. Pre-heparin HTGL levels in diabetics were higher than in healthy volunteers. However, the number of healthy controls was small and their age was young. Therefore, more controls of different ages need to fairly compare HTGL levels between diabetics and non-diabetics. The ELISA system used in this study had a strong positive correlation between pre-heparin HTGL concentration and PHP-HTGL concentration and a strong correlation between activity and concentration of HTGL in PHP 8). Therefore, HTGL concentration may reflect HTGL activity even in pre-heparin plasma. We observed that pre-heparin HTGL concentrations positively correlated with LDL-C concentration. This is in good agreement with Glaser’s report using pre-heparin HTGL activity 3). HTGL facilitates the conversion from IDL to LDL by lipolyzing the TG moiety of IDL 1). Therefore, the link between HTGL and LDL-C is reasonable. SdLDL-C and LDL-TG levels are expected to correlate significantly with HTGL as HTGL hydrolyzes TG-rich LDL and generalizes lipid-poor sdLDL particles 10)11). Indeed, Muraba et al 21) reported that the HTGL concentration was positively correlated with sdLDL-C. Contrary to expectations, we could not find an intimate relationship between them. Nevertheless, there was an inverse relationship between HTGL and LDL-TG / LDL-C or LDL-TG / apoB. This is consistent with the action of HTGL on reducing TG in LDL particles.
HTGL, which has both TG lipase and phospholipase activity, plays an important role in phospholipid-enriched HDL metabolism. High HTGL activity reduces HDL2 and increases HDL3 22). HDL-C mainly consists of HDL2-C 20), thus HDL-C inversely correlate with PHP-HTGL activity 23). Miyashita et al 7) reported that there was a weak relation of pre-heparin HTGL concentration against HDL-C. Unlike their results, we did not find any significant associations between pre-heparin HTGL and HDL-related measurements such as HDL2-C, HDL3-C, and apo AI (a main protein of HDL2).
We previously reported that both pre-heparin LPL and PHP-LPL were significantly lower in patients with type 2 diabetes, and there was a weak correlation between the pre-heparin LPL and PHP-LPL concentrations 15). Our previous and current studies have consistently shown that pre-heparin LPL levels are inversely correlated with TG and positively correlated with HDL-C, which is well documented in PHP-LPL 23). Moreover, we found an inverse association between pre-heparin LPL concentrations and RLP-C. LDL-TG, or sdLDL-C/LDL-C. This could be explained by LPL-induced TG-lowering action, because RLP-C, LDL-TG, and sdLDL-C/LDL-C are closely associated with TG. We also observed close relationship between pre-heparin LPL and HDL2-C or apo AI. LPL delivers unesterified cholesterol derived from the surface of TG-rich lipoproteins to smaller HDL particle via phospholipid transfer protein, resulting in generation of cholesterol-enriched HDL2 24). Our results suggest that the enzymatically inactive LPL still reflects the biological effect of this enzyme on all lipoprotein metabolism.
Nishimura et al 6) reported that HTGL protein concentrations in PHP in healthy subjects were about 2000 ng/mL. Pre-heparin HTGL levels were 57 ng/mL in diabetics and 44 ng/mL in healthy subjects, resulting in only 2-3% of PHP-HTGL levels. This absolute low concentration of pre-heparin HTGL may be the reason why the important physiological role of this enzyme in lipoprotein metabolism cannot be detected. On the other hand, PHP-LPL is about 250 ng/mL and pre-heparin LPL is 50 ng/mL, accounting for 20% of PHP-LPL 15). The abundance of LPL in pre-heparin plasma could reflect physiological action of this enzyme. Several studies suggest an association between HTGL and central fatty obesity or fatty liver 1)8). We failed to find this association, but found inverse correlation between LPL and VFA. Because pre-heparin LPL is reduced by metabolic disturbance 15), our results suggest that pre-heparin LPL is superior to HTGL for a marker of metabolic syndrome. However, majority of present subjects were treated with lipid-lowering and glucose-lowering drugs, which strongly affect lipid metabolism and obesity. Therefore, the effects of these drugs may mask the important effects of HTGL on lipoprotein metabolism or adiposity. This is the limit of our current research.
V. In conclusion
Pre-heparin plasma HTGL protein concentrations measured by a sensitive ELISA may have limited clinical relevance compared to pre-heparin plasma LPL protein at least in diabetic populations.
Acknowledgement
We would like to thank Mrs. Hiroko Takeuchi for her excellent technical support.
Funding
This study was partially supported by Denka Co., Ltd. The source of funding was not involved in designing, conducting surveys, analyzing, or interpreting the data.
COI
Tsutomu Hirano received consultant fee from Denka Co, and lecture fee from Kowa Co.
References
- Brunzell JD, Zambon A, Deeb SS. The effect of hepatic lipase on coronary artery disease in humans is influenced by the underlying lipoprotein phenotype. Biochim Biophys Acta 2012; 1821(3): 365-72. PubMed
- Krauss RM, Levy RI, Fredrickson DS. Selective measurement of two lipase activities in postheparin plasma from normal subjects and patients with hyperlipoproteinemia. J Clin Invest 1974; 54(5): 1107-24. PubMed
- Glaser DS, Yost TJ, Eckel RH. Preheparin lipoprotein lipolytic activities: relationship with plasma lipoprotein and postheparin lipolytic activities. J Lipid Res. 1992; 33(2): 209-14. PubMed
- Watson TD, Tan CE, McConnell M, et al. Measurement and physiological significance of lipoprotein and hepatic lipase activities in preheparin plasma. Clin Chem 1995; 41(3):405-12. PubMed
- Nakajima K, Machida T, Imamura S, et al. An automated method for measuring lipoprotein lipase and hepatic triglyceride lipase activities in post-heparin plasma. Clin Chim Acta 2018; 487: 54-9. PubMed
- Nishimura M, Iwanaga T, Ohkaru Y, et al. Change in immunoreactive human hepatic triglyceride lipase (HTGL) mass and the shelf-life of the HTGL ELISA kit in long-term storage. J Immunoassay Immunochem 2006; 27(1): 89-102. PubMed
- Miyashita K, Kobayashi J, Imamura S, et al. A new enzyme-linked immunosorbent assay system for human hepatic triglyceride lipase. Clin Chim Acta 2013; 424: 201-6. PubMed
- Miyashita K, Nakajima K, Fukamachi I, et al. A new enzyme-linked immunosorbent assay system for human serum hepatic triglyceride lipase. J Lipid Res 2017; 58(8): 1591-97. PubMed
- Carr MC, Hokanson JE, Zambon A, et al. The contribution of intraabdominal fat to gender differences in hepatic lipase activity and low/high density lipoprotein heterogeneity. J Clin Endocrinol Metab 2001; 86(6): 2831-7. PubMed
- Carr MC, Ayyobi AF, Murdoch SJ, et al. Contribution of hepatic lipase, lipoprotein lipase, and cholesteryl ester transfer protein to LDL and HDL heterogeneity in healthy women. Arterioscler Thromb Vasc Biol 2002; 22(4): 667-73. PubMed
- Hirano T. Pathophysiology of diabetic dyslipidemia. J Atheroscler Thromb 2018; 25(9): 771-82.
- Wang H, Eckel RH. Lipoprotein lipase: from gene to obesity. Am J Physiol Endocrinol Metab 2009; 297(2): E271-88. PubMed
- Kern PA, Martin RA, Carty J, et al. Identification of lipoprotein lipase immunoreactive protein in pre- and postheparin plasma from normal subjects and patients with type I hyperlipoproteinemia. J Lipid Res. 1990;31:17-26.PubMed
- Ikeda Y, Takagi A, Ohkaru Y, et al. A sandwich-enzyme immunoassay for the quantification of lipoprotein lipase and hepatic triglyceride lipase in human postheparin plasma using monoclonal antibodies to the corresponding enzymes. J Lipid Res. 1990; 31(10): 1911-24. PubMed
- Hirano T, Nishioka F, Murakami T. Measurement of the serum lipoprotein lipase concentration is useful for studying triglyceride metabolism: Comparison with postheparin plasma. Metabolism 2004; 53(4): 526-31. PubMed
- Kobayashi J, Nakajima K, Nohara A, et al. The relationship of serum lipoprotein lipase mass with fasting serum apolipoprotein B-48 and remnant-like particle triglycerides in type 2 diabetic patients. Horm Metab Res 2007; 39(8): 612-6. PubMed
- Kobayashi J, Hashimoto H, Fukamachi I, et al. Lipoprotein lipase mass and activity in severe hypertriglyceridemia. Clin Chim Acta 1993; 216(1-2): 113-23. PubMed
- Ito Y, Ohta M, Ikezaki H, et al. Development and population results of a fully automated homogeneous assay for LDL triglyceride. J Appl Lab Med 2018; 2(5): 746-56. PubMed
- Ito Y, Fujimura M, Ohta M, et al. Development of a homogeneous assay for measurement of small dense LDL cholesterol. Clin Chem 2011; 57(1): 57-65. PubMed
- Ito Y, Satoh N, Ishii T, et al. Development of a homogeneous assay for measurement of high-density lipoprotein-subclass cholesterol. Clin Chim Acta 2014; 427: 86-93. PubMed
- Muraba Y, Koga T, Shimomura Y, et al. The role of plasma lipoprotein lipase, hepatic lipase and GPIHBP1 in the metabolism of remnant lipoproteins and small dense LDL in patients with coronary artery disease. Clin Chim Acta 2018; 476: 146-53. PubMed
- Katzel LI, Coon PJ, Busby MJ, et al. Reduced HDL2 cholesterol subspecies and elevated postheparin hepatic lipase activity in older men with abdominal obesity and asymptomatic myocardial ischemia. Arterioscler Thromb 1992; 12(7): 814-23. PubMed
- Shirakawa T, Nakajima K, Shimomura Y, et al. Comparison of the effect of post-heparin and pre-heparin lipoprotein lipase and hepatic triglyceride lipase on remnant lipoprotein metabolism Clin Chim Acta. 2015;440:193-200. PubMed
- Cheung MC, Sibley SD, Palmer JP, et al. Lipoprotein lipase and hepatic lipase: their relationship with HDL subspecies Lp(A-I) and Lp(A-I,A-II). J Lipid Res 2003; 44(8): 1552-8. PubMed