Rin Yokoyama*1, Yoshifumi Morita*1, Haruna Shibayama*1, Naoyuki Yoshikawa*1 Masami Tanaka*1, Yoshikazu Ono*1, Hideaki Isago*1,2, Makoto Kurano*1,2
Yokoyama R, Morita Y, Shibayama H, Yoshikawa N, Tanaka M, Ono Y, Isago H, Kurano M. Measuring ascites and urinary presepsin levelsmay be useful for diagnosing local infection: a retrospective cross-sectional study.
Lab Med Int 2025; 4(3): 75-84. doi: 10.51041/lmi.4.3_75
Original
Lab Med Int 2025; 4(3): 75-84
Correspondence: Department of Clinical Laboratory, the University of Tokyo Hospital,The University of Tokyo, 7-3-1 Hongo, Bunkyo-ku, Tokyo 113-8655, Japan
Tel: +81-3-3815-5411; Fax: +81-3-5689-0495;
E-mail: yokoyamar-lab”@”h.u-tokyo.ac.jp (R.Y.)
Received November 8, 2024; accepted May 19, 2025
*1 Department of Clinical Laboratory, the University of Tokyo Hospital, Tokyo 113-8655, Japan
*2 Department of Clinical Laboratory Medicine, Graduate School of Medicine, the University of Tokyo, Tokyo 113-8655, Japan
ABSTRACT
Presepsin (P-SEP) is a well-known biomarker for diagnosing sepsis. Although recent reports have demonstrated the usefulness of measuring P-SEP in the blood, there is insufficient evidence in other samples. This study aimed to explore the clinical usefulness of measuring P-SEP in pleural fluid, ascites, and urine. We used a fully automated analyzer (STACIA) to measure P-SEP levels and compared P-SEP levels with other clinical data. Receiver operating characteristic curve analysis, which was used to separate cases of positive culture test using ascites P-SEP level, showed that the area under the curve was 0.832. The sensitivity and specificity were 94.1% and 85.7%, respectively, when 1,842 pg/mL of ascites P-SEP was used as the cutoff value. In urine, the P-SEP/creatinine ratio of patients who showed pyuria was significantly higher than that of the control group. The results suggest the possible usefulness of P-SEP in ascites and urine, for evaluating local infection.
〔Lab Med Int 2025; 4(3): 75-84〕
Key Words
presepsin, ascites, urine, biomarker, abdominal infection
I. Introduction
Presepsin (P-SEP) is a 13-kDa soluble N-terminal fragment of CD14, which is a receptor for lipopolysaccharide and lipopolysaccharide-binding protein complex 1)2). Two main mechanisms have been proposed for P-SEP induction: (1) Monocytes directly produce P-SEP after phagocytosing bacteria. (2) Monocytes phagocytose neutrophils forming NETs, and CD14 on the surface of the monocyte cell membrane is degraded intracellularly, resulting in P-SEP secretion 3)4).
In clinical practice, measuring serum P-SEP levels is useful for diagnosing sepsis and its severity 5)–10). Considering the aforementioned mechanisms, P-SEP is useful for detecting bacterial infection. Thus, theoretically, the measurement of P-SEP may be useful for diagnosing not only systemic bacterial infections such as sepsis but also local bacterial infections.
In fact, recent reports have demonstrated the usefulness of measuring P-SEP not only in the blood but also in other samples. High levels of P-SEP are observed in the pleural fluid of patients with empyema and parapneumonic effusion 11). P-SEP levels in synovial fluid are useful for the differential diagnosis of native joint septic arthritis and crystal arthritis with a sensitivity and specificity of 100% 12)13). P-SEP in cerebrospinal fluid is also useful for diagnosing bacterial meningitis, and its diagnostic ability is superior to that of leukocytes or proteins in cerebrospinal fluid 14).
However, the modulations of P-SEP in urine by bacterial urinary tract infection remain unknown. Moreover, there is still insufficient evidence regarding the modulation of P-SEP in pleural fluid and ascites, especially in the aspects of bacterial infection. Therefore, in order to explore the usefulness of P-SEP in samples other than the serum, the present study aimed to validate the measurement of ascites, pleural fluid, and urinary P-SEP levels and to evaluate their diagnostic ability for local bacterial infection.
II. Materials and methods
Samples
For ascites and pleural fluid, 46 ascites and 45 pleural fluid samples were obtained from residual specimens from routine clinical laboratory testing collected by body cavity puncture. In ascites fluid, samples with a serum–ascites albumin gradient (SAAG) of less than 1.1 were determined to be exudate. In pleural fluid, Light’s criteria were used to determine whether the fluid was transudate or exudate. Briefly, the samples were determined as exudates if at least one of the following exists: (1) The ratio of pleural fluid protein to serum protein is <0.5. (2) The ratio of pleural fluid lactose dehydrogenase (LDH) to serum LDH is <0.6. (3) The pleural fluid LDH is <2/3 of the upper reference limit. The serum clinical laboratory data on the same day were used to determine whether the sample was transudate or exudate. If culture tests were performed during the same hospital stay, the results were obtained from the medical records (Supplemental Table 1). Once a positive culture test result was obtained, it was regarded as a culture-positive group.
For urine, subjects who were clinically diagnosed with specific kidney diseases, including those diagnosed with renal biopsy, were enrolled. A total of 138 residual urine specimens were collected after routine clinical laboratory testing from 6 subjects with diabetes mellitus, 10 subjects with renal sclerosis, 4 subjects with chronic glomerulonephritis, 17 subjects with IgA nephropathy, 13 subjects with vasculitis syndrome, 6 subjects with systemic lupus erythematosus (SLE), 2 subjects with minimal change disease, 7 subjects with membranous nephropathy, 4 subjects with focal segmental glomerulosclerosis, 1 subject with membranoproliferative glomerulonephritis, and 11 subjects with other renal diseases. A total of 32 subjects with >10 white blood cells (WBCs)/µL in their urine as quantified by flow cytometry were included in the pyuria group. Meanwhile, 25 subjects with no evidence of proteinuria and pyuria as verified by dipstick test and flow cytometry, respectively, were included in the control group. All laboratory data, except P-SEP, were extracted from medical records.
Collection of samples
Residual ascites fluid, pleural fluid, or urine samples were collected after routine clinical laboratory testing and stored at −80℃ until analysis. Ascites and pleural fluids were collected from a collection tube with EDTA-2K powder, whereas urine was collected from a plain collection tube. Then, samples were centrifuged to separate the supernatant and material components (at 2,300 g for 5 min for ascites and pleural fluids and at 1,700 g for 5 min for urine before collection). For the method validation experiments, pooled samples were prepared by mixing residual samples after routine testing of pleural fluid, ascites, and urine submitted to the clinical laboratory from September 2018 to April 2021 in. any proportion.
Measurement of P-SEP
P-SEP was measured using the fully automated clinical analyzer STACIA and STACIA CLEIA Presepsin (PHC Corporation, Tokyo, Japan), which was based on chemiluminescent enzyme immunoassay (CLEIA). Briefly, a sandwich complex was formed between anti-P-SEP antibody-coated paramagnetic latex beads and alkaline phosphatase (ALP)-labeled anti-P-SEP antibody, if P-SEP was present in the sample. Next, nonmagnetic materials were washed out with a wash buffer under a magnetic field. Then, disodium 2-chloro-5-(4-methoxyspiro[1,2-dioxetane-3,2′-(5-chlorotricyclo[3.3.1.13.7]decan])-4-yl]-1-phenyl phosphate was added and hydrolyzed by ALP in the complex, emitting light. Finally, the results were determined as pg/mL using a calibration curve generated by five-point calibration. Because the measurement range in the manufacturer’s instrument reaches up to 20,000 pg/mL, samples exceeding 20,000 pg/mL were diluted and measured using the manufacturer’s diluent. Both devices have been approved by the Pharmaceuticals and Medical Devices Agency in Japan.
Method validation
The precision of the assay for 10 replicates was investigated using two pooled samples composed of pleural fluid and ascites for validation of the pleural fluid and ascites measurement. For validation of urine measurement, a pooled urine sample for 20 replicates was measured. According to the manufacturer’s instructions, the coefficient of variation is less than 10% when the control samples are measured. Linearity was investigated using two types of pooled samples composed of pleural fluid and ascites or urine samples from one patient. Briefly, each sample was diluted up to 10 times with the manufacturer’s diluent. In the urine experiment, one sample was diluted up to five times.
Spike and recovery tests were performed using pleural fluid, ascites, urine, and the manufacturer’s standard. The standard was diluted with the manufacturer’s diluent at approximately 500 pg/mL before being used in the experiments. Two pleural fluid, ascites, and urine samples were mixed with the standard in the proportions shown in Table 2. The recovery rate was calculated using the following method: (1) The P-SEP levels of mixed samples were measured. (2) Expected values were calculated by the proportion of mixture of the sample and standard. (3) The recovery rate was determined by the ratio of the measured value to the expected value when the expected value was 100%.
Statistical analysis
The Mann–Whitney U test was used for comparisons between two groups. Spearman’s rank correlation coefficient was calculated to evaluate the correlations between urinary P-SEP levels and other clinical laboratory data. Statistical analyses were performed using IBM SPSS Statistics 27 (NY, USA). Steel’s multiple comparison test, which was used for comparisons between the control and other groups, and receiver operating characteristic curve analysis were performed using JMP Pro 16 (Cary, USA). Statistical significance was considered at p<0.05.
Ethical consideration
The present study was conducted in accordance with the ethical guidelines established in the Declaration of Helsinki. Informed consent was obtained in the form of an opt-out form on the website for participants: patients were informed about the study on the website (http://lab-tky.umin.jp/clinical_research/3333_161.pdf), and those who were unwilling to be enrolled in the study were excluded. If the participants were minors, their parents or guardians could waive participation in this study on their behalf. The study design was approved by the University of Tokyo Medical Research Center Ethics Committee, which waived the need for written informed consent because only archived specimens were used and data for this retrospective study were retrieved from medical records (3683 and 3333-161).
III. Results
Method validation
First, we verified the repeatability with 10 replicates for pleural fluid and ascites and 20 replicates for urine using pooled samples. The precision of the assay was 3.1%–3.5% for P-SEP measurement in pleural fluid and ascites and 4.8% for P-SEP measurement in urine (Table 1).
Linearity was validated using linear regression analysis and both pooled pleural fluid and ascites and urine from a patient. The linearity curves of P-SEP in the pleural fluid, ascites, and urine samples are shown in Figure 1. The curves exhibited good linearity up to 19,482 pg/mL for P-SEP in pleural fluid and ascites and 967 pg/mL for P-SEP in urine.
To explore the accuracy of P-SEP measurement in pleural fluid, ascites, and urine, spike and recovery tests were performed using two or three types of samples. The recovery rates ranged from 94.8% to 104.8% for pleural fluid, from 93.0% to 103.1% for ascites, and from 95.5% to 101.6% for urine (Table 2).
Levels of P-SEP in pleural fluid and ascites
To investigate the association of P-SEP with Light’s criteria or SAAG classification of transudate/exudate, we measured P-SEP in 43 pleural fluid samples for which Light’s criteria could be evaluated and 42 ascites fluid samples for which SAAG could be calculated. P-SEP levels were compared between the transudate and exudate groups. As shown in Figures 2A and B, the median and range of P-SEP in the transudate pleural fluid, exudate pleural fluid, transudate ascites, and exudate ascites groups were 741.0 (322–12,341), 1,084.0 (296–11,604), 1,076.5 (434–21,664), and 1,537.0 (583–5,304) pg/mL, respectively. All samples exceeded 50 pg/mL, which is the lower limit of the measurement range in the manufacturer’s instructions. In addition, there was no difference in P-SEP levels between transudate and exudate in either pleural fluid or ascites. However, when the pleural fluid and ascites P-SEP levels were compared between the groups of cases in which the culture test became positive or negative, there was no significant difference in P-SEP levels in pleural fluid between the two groups, whereas the P-SEP levels in ascites fluid were significantly higher in the culture-positive group (Figures 2C and D).
Usefulness of P-SEP measurement for detecting culture-positive ascites
To further understand the significance of P-SEP in ascites, we performed receiver operating characteristic curve analysis to separate cases of positive culture test using the P-SEP level or WBC in ascites, which are used to diagnose acute peritonitis. The WBC levels in the culture-positive group were significantly higher than those in the culture-negative group (Supplemental Figure 1). The area under the curve for ascites P-SEP was 0.832 (95% confidence interval, 0.649–1.000), and that for ascites WBC was 0.910 (95% confidence interval, 0.773–1.000). Based on Youden’s index, the optimal cutoff values for ascites P-SEP and ascites WBC were identified as 1,842 pg/mL and 3.3 × 10⁹ counts/L, respectively (Figure 3A, Table 3, Supplemental Figure 1 and Supplemental Table 2).
Next, we evaluated whether a combination of cutoff values for ascites P-SEP and WBC would improve the diagnostic ability to be culture-positive. The specificity improved from 94.1% (when only ascites WBC was measured) to 100% (when ascites WBC and P-SEP were measured) when the cutoff values for culture-positive cases were set as 1,842 pg/mL for P-SEP and 3.3 × 10⁹ counts/L for ascites WBCs (Figure 3B, Table 3B). On the other hand, the sensitivity for culture-positive cases remained as high as 85.7%.
Usefulness of measuring urinary P-SEP for detecting bacterial urinary tract infection
We compared the P-SEP/creatinine ratios in the urine of patients with pyuria, nephritis, or other kidney diseases with those of controls to investigate the possible usefulness of urinary P-SEP. Figure 4A shows that the urinary P-SEP/creatinine ratio in the pyuria group was significantly higher than that in the control group. Next, we investigated the correlations between the urinary P-SEP/creatinine ratio and estimated glomerular filtration rate (eGFR) or urinary WBC. Figures 4B and C show a significant negative correlation between the urinary P-SEP/creatinine ratio and eGFR and a significant weakly positive correlation between the urinary P-SEP/creatinine ratio and WBC count. These negative correlations were also observed when P-SEP was not correlated with urinary creatinine (Figures 4D and E).
Table 1 Repeatability of P-SEP measurement in pleural fluid, ascites, and urine
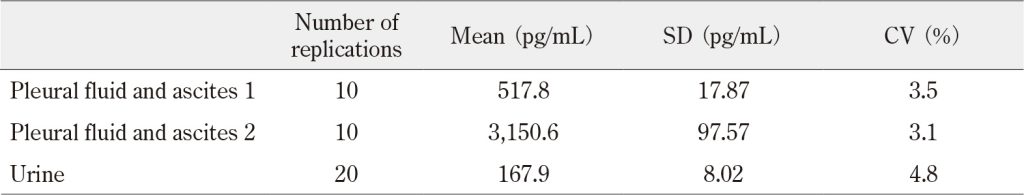
P-SEP was measured in pooled pleural fluid and ascites and urine with 10 or 20 replicates. SD, standard deviation; CV, coefficient of variation
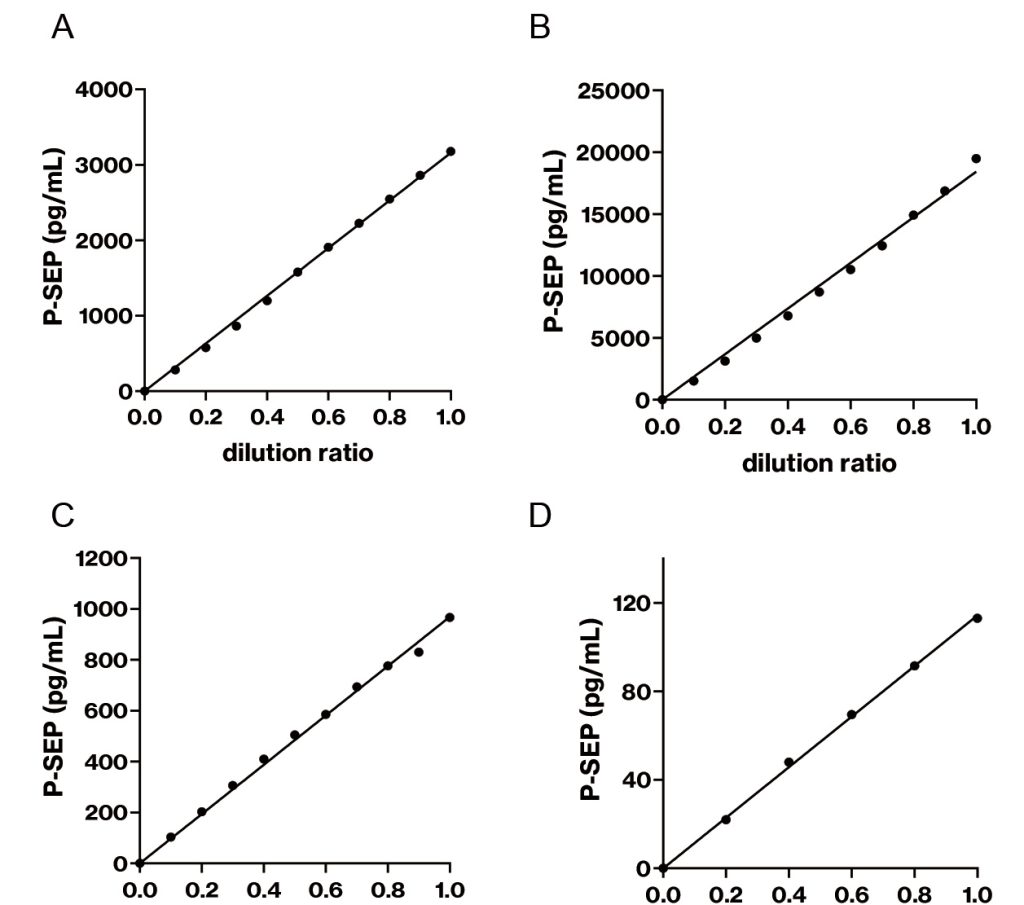
Figure 1 Linearity analysis of pleural fluid and ascites and urinary P-SEP.
The dilution linearities of pleural fluid and ascites (A, B) and urine (C, D) were investigated. A sample was diluted 5
to 10 times with the manufacturer’s diluent. Then, each sample was analyzed with two replicates.
Table 2 Recovery rates of spike and recovery tests in pleural fluid, ascites, and urine
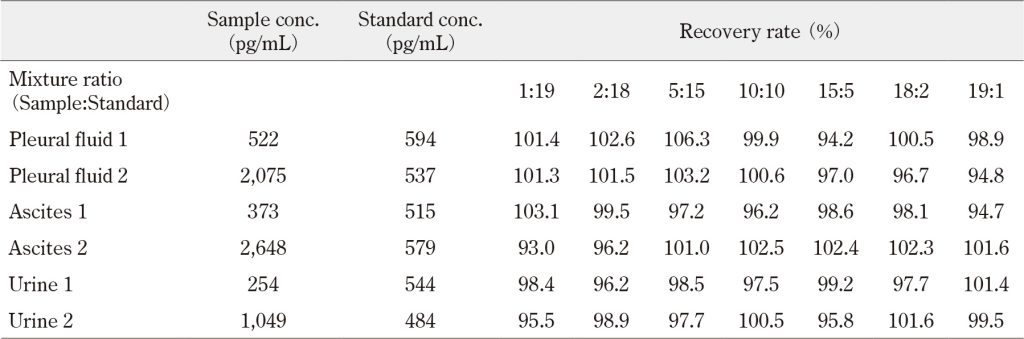
Pleural fluid, ascites, and urine samples were mixed with standard solution in several proportions and measured. The
recovery rate was calculated by the ratio of the measured P-SEP level to the expected P-SEP level when the expected
P-SEP level in each mixture ratio was defined as 100%. All values represent the average of three replicates.
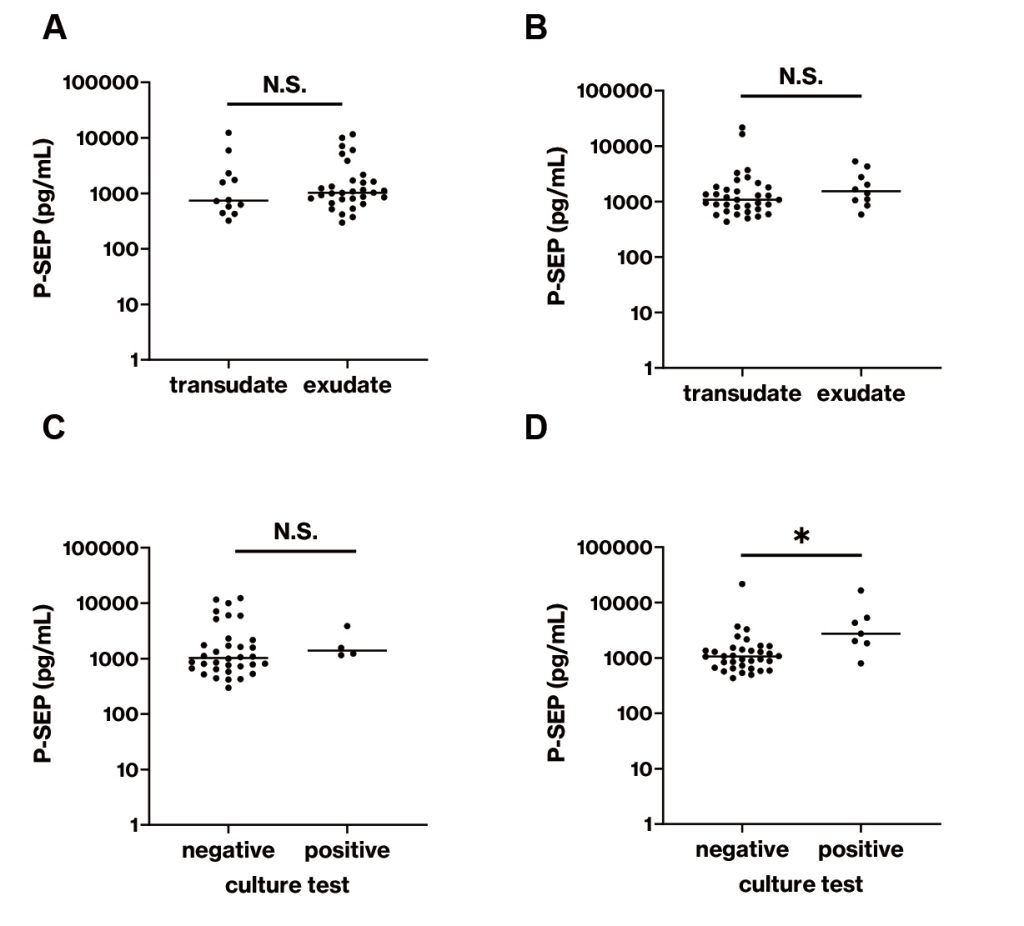
Figure 2 Comparisons of P-SEP levels in pleural fluid and ascites.
P-SEP levels in pleural fluid and ascites samples were measured. (A) Comparison of P-SEP level in pleural fluid
samples between transudate (n=12) and exudate (n=31) divided by Light’s criteria. (B) Comparison of P-SEP level
in ascites between transudate (n=34) and exudate (n=10) divided by SAAG classification. (C) Comparison of P-SEP
level in pleural fluid between culture test-negative (n=34) and positive cases (n=4). (D) Comparison of P-SEP level
in ascites between culture test-negative (n=34) and positive cases (n=7). *, p<0.05; N.S., not significantly different
IV. Discussion
We validated a method for quantifying P-SEP in pleural fluid, ascites, and urine using the fully automated clinical analyzer STACIA. First, the repeatability of pleural fluid, ascites, and urine was not inferior to that of the manufacturer’s instrument for serum P-SEP, which was less than 10% (Table 1). These results suggested that this measurement system provided relatively stable data even if P-SEP in pleural fluid, ascites, and urine was measured. The linearity was good (up to 19,482 pg/mL for pleural fluid and ascites and 967 pg/mL for urine) (Figure 1). The linearity for urine above 967 pg/mL was unclear because a sufficient volume of urine containing high concentration of P-SEP was collected. Several urine samples contained more than 967 pg/mL of P-SEP; however, we measured these samples without dilution because the manufacturer’s instrument defined the measurable range as 50–20,000 pg/mL. The recovery rate for measuring P-SEP in pleural fluid and ascites ranged from 93.0% to 106.3% (Table 2). The recovery rate of pleural fluid 2 slightly decreased with increasing proportion of sample. However, a proportional systematic error was not observed in pleural fluid 1. For urine, a proportional systemic error was not observed, regardless of how the ratio of sample to standard changed. These results suggest that no specific matrix effects for the measurement of P-SEP exist in pleural fluid, ascites, and urine. Based on these results, the application of the method for measuring serum and plasma P-SEP, which has already been approved by the Pharmaceuticals and Medical Devices Agency in Japan, to pleural fluid, ascites, and urine provides a performance equivalent to that of serum.
Pleural fluid and ascites P-SEP levels may be higher than serum P-SEP levels. The serum P-SEP level from 128 healthy subjects was reported to be 190 pg/mL 6). This difference can be explained by the fact that pleural fluid and ascites reflect the local production of P-SEP. Consistent with the present study, Watanabe et al. reported that pleural fluid P-SEP levels were significantly higher than those in plasma, whereas the level of C-reactive protein in pleural fluid was significantly lower than that in plasma 11).
With regard to clinical usefulness, ascites P-SEP of the culture test-positive group was significantly higher than that of the negative group, whereas no significant difference in ascites P-SEP levels was observed between the transudate and exudate groups (Figures 2B and D). According to this result, we speculate that WBCs migrating into the peritoneal cavity produce P-SEP to exclude bacteria. In fact, a positive correlation between ascites WBCs and P-SEP was observed (r=0.409, p<0.01). The reason that exudative ascites, which is classically considered as an accumulation with inflammation including bacterial infection, was not significantly higher may be because of the method used to calculate SAAG or the fact that ascites does not emerge in healthy individuals. In this study, three cases of positive culture test were classified into the transudate group because their SAAG values were 1.1. These cases might have been classified as the transudate group due to measurement error because the smallest unit of albumin measurement was 0.1. In addition, SAAG has a 96.7% positive diagnostic rate for the presence of portal hypertension 15). Therefore, when SAAG is used alone, its performance may be inadequate with respect to its ability to discriminate peritonitis. In this study, pleural fluid P-SEP level of the culture test-positive group was not significantly higher than that of negative group. Two possible explanations can be considered. One is the small number of pleuritis cases (n=5), and the other is the inclusion of several empyema cases in the culture-negative group.
The area under the curve of ascites P-SEP to separate positive or negative results of culture test was relatively high but inferior to that of ascites WBCs. Thus, we attempted to combine these values to discriminate positive or negative culture tests. As a result, the specificity was improved and reached 100%. Ascites WBC and P-SEP tests can be completed quickly and may be useful for diagnosing abdominal bacterial infection prior to culture testing.
A widely known inflammatory marker is procalcitonin. Viallon et al. reported that the AUC of 0.96 when diagnosing spontaneous bacterial peritonitis (SBP) using ascites procalcitonin 16). It is higher than that of ascites P-SEP in our study (AUC 0.832). The sensitivity of diagnosing SBP using procalcitonin was better than that of ascites WBC and P-SEP test. However, there is a difference in that the previous study regarded patients with ascites WBC more than 2.5 × 10⁹ count/L with diagnosis of SBP as the positive group, whereas in this study, patients with positive ascites culture test were regarded as the positive group. Elsadek et al. reported that the PEC index, which was calculated using procalcitonin (PCT), erythrocyte sedimentation rate (ESR), and C-reactive protein (CRP) as follows: PEC index = PCT × (ESR + CRP), efficiently diagnosed SBP in cirrhotic patients 17). Actually, the PEC index had high sensitivity and specificity for SBP diagnosis (98.33% and 96.67%, respectively, AUC 0.977). The PEC index may have superior sensitivity and specificity compared to our presepsin-based method in the diagnosis of SBP even though the definition of abdominal infection and the disease background of the patient population differ from our study. On the other hand, the ascites WBC and P-SEP test in our study has three advantages in routine clinical practice in the laboratory: 1. only one tube containing EDTA-2K required, 2. no need for complex calculation, 3. measurement completed within one hour.
Whether there is a correlation between ascites P-SEP level and severity of disease is an interesting question. In this study, the patient with the highest ascites P-SEP level of 21,664 pg/mL in culture-positive ascites was not severe and was discharged from the hospital 36 days after ascites collection without being admitted to the intensive care unit. On the other hand, the patient with a P-SEP level of 4,312 pg/mL had severe peritonitis and died 45 days after ascites collection. In this study, the results did not suggest a correlation between P-SEP level and severity.
Regarding the urinary levels of P-SEP, the median urinary P-SEP level of healthy subjects was 48.5 pg/mL, which is considerably lower than that of the pleural fluid, ascites, and serum. We hypothesized that the lower urinary P-SEP level resulted from the urine production process, which was increasingly produced regardless of the pathological condition. As shown in Figures 4B and D, the negative correlation between eGFR and urinary P-SEP may indicate that decreased tubular reabsorption capacity rather than decreased glomerular filtration rate may contribute to the excretion of P-SEP into urine. To our knowledge, this study is the first to clarify the relationship between urinary P-SEP and renal function, although some reports have shown that elevated blood P-SEP levels were observed in patients with kidney dysfunction 18)19). Additionally, we found a positive correlation between urinary WBC count and P-SEP (Figures 4C and E). These results suggest that WBCs migrating to urine are considerably involved in the production of P-SEP. However, the origin of urinary P-SEP remains unclear because most WBCs migrating to urine are neutrophils, contradicting reports that monocytes/macrophages are strongly involved in the production of P-SEP 3).
Regarding the clinical usefulness of measuring urinary P-SEP, the urinary P-SEP levels in the pyuria group were significantly higher than those in the control group (Figure 4A). Moreover, urinary P-SEP levels were positively correlated with urinary WBC counts (Figures 4C and E). These results suggest that WBCs migrating to the urinary tract may produce P-SEP, and measuring urinary P-SEP might be useful to analyze urinary inflammation. However, because urinary P-SEP was elevated in patients with renal dysfunction, we searched for the eGFR in patients whose urinary P-SEP exceeded 500 ng/g・Cr. Of the numbers of urine samples with P-SEP above 500 ng/g・Cr, eGFR below 30 mL/min/1.73 m2 were 0 of 1 in the control group, 2 of 5 in the pyuria group, 1 of 1 in the IgA nephropathy group, 4 of 4 in the diabetes mellitus group, 2 of 3 in the sclerosis group, and 2 of 2 in other groups. Except for the control and pyuria groups, elevated urinary P-SEP levels might not reflect infection but renal dysfunction. Therefore, further study is required because measurement of urinary P-SEP may be valuable in the diagnosis of urinary tract infections and evaluation of disease status.
This study had several limitations. First, because the study was a retrospective cross-sectional study, future prospective longitudinal studies are needed to confirm the results of the present study. Second, further analysis should consider clinical symptoms because we evaluated the diagnostic ability of ascites P-SEP level not for peritonitis but for culture-positive cases. Finally, it remains unclear why the urinary P-SEP level was increased in cases without pyuria.
In conclusion, we have validated a method of measuring P-SEP in pleural fluid, ascites, and urine instead of the blood, which is broadly used to measure P-SEP. Here, we demonstrated that measuring ascites and urinary P-SEP may be useful to evaluate local bacterial infection. However, further studies are needed to confirm the usefulness of P-SEP as a biomarker of local bacterial infection.
Funding
This work was supported by joint research fund provided by PHC Corporation.
Authorship contributions
R. Y. participated in the experiments and data analysis and drafted the initial manuscript; Y. M. participated in the experiments, participated in the discussion, and helped in drafting the manuscript; H. S. participated in the experiments; N. Y., M. T., Y. O., and H.I. participated in the discussion and helped in drafting the manuscript; M. K. conceived the study, coordinated the study design, and helped in drafting the manuscript. All the authors have read and approved the final manuscript.
Disclosure of conflicts of interest
The authors declare the following financial interests/personal relationships which may be considered as potential competing interests: Rin Yokoyama reports financial support and equipment were provided by PHC Corporation. The other authors declare that they have no known competing financial interests or personal relationships that could have appeared to influence the work reported in this paper. The present study was performed under a joint research project at the University of Tokyo Hospital with PHC Corporation.
Acknowledgements
We would like to thank Takuya Shimura for providing helpful insights. We would also like to thank Enago for English language copyediting.
Abbreviations:
ALP, alkaline phosphatase; CGN, chronic glomerulonephritis; CLEIA, chemiluminescent enzyme immunoassay; DM, diabetes mellitus; eGFR, estimated glomerular filtration rate; FSGS, focal segmental glomerulosclerosis; IgAN, IgA nephropathy; LDH, lactose dehydrogenase; LN, lupus nephritis; MCD, minimal change disease; MN, membranous nephropathy; MPGN, membranoproliferative glomerulonephritis; P-SEP, presepsin; SAAG, serum–ascites albumin gradient; SBP, spontaneous bacterial peritonitis; WBC, white blood cell
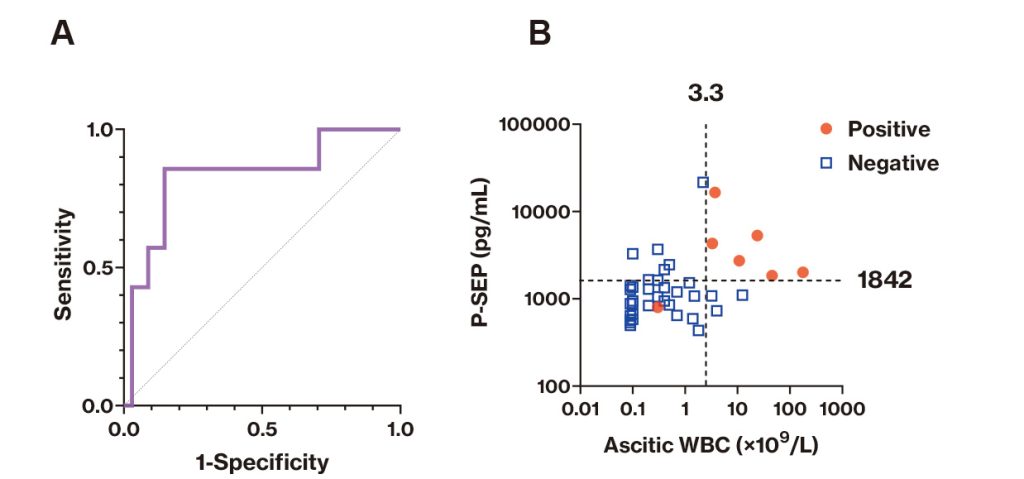
Figure 3 Diagnostic ability of ascites P-SEP for culture-positive case.
(A) Receiver operating characteristic curve analysis was performed to separate culture test-positive cases (n=7)
from culture test-negative cases using the P-SEP level in ascites and to show the area under the curve. (B) Twodimensional plot with ascites P-SEP levels on the vertical axis and ascites WBC levels on the horizontal axis. Blue
squares indicate negative cases for culture test, whereas red circles indicate positive cases for culture test. In the WBC
counting tests, data under the mechanical detection limit (0.1 cells/μL) were regarded as 0.1 cells/μL.
Table 3 Diagnostic ability of ascites P-SEP for culture-positive case
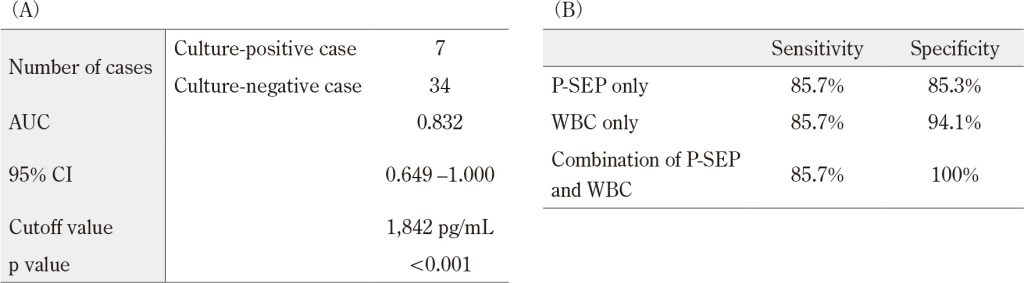
Receiver operating characteristic curve analysis was performed. (A) The results of receiver operating characteristic
curve analysis for culture-positive case using ascites P-SEP level are shown. The cutoff value was determined
based on Youden’s index. (B) The sensitivity and specificity to diagnose culture-positive case were calculated if
ascites P-SEP alone, ascites WBC alone, and both were used for diagnosis. In WBC counting tests, data under the
mechanical detection limit (0.1 cells/μL) were regarded as 0.1 cells/μL.
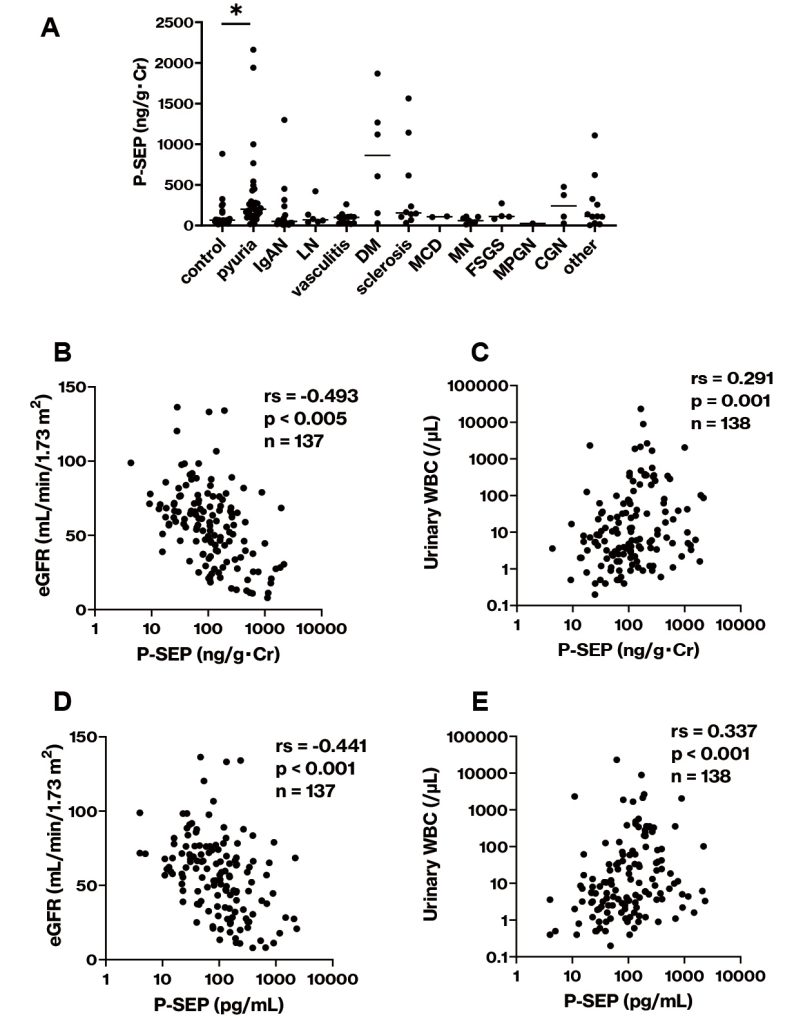
Figure 4 Urinary P-SEP levels in patients.
(A) The urinary P-SEP/creatinine ratio was compared among various patients with renal dysfunction. (B–D) The
urinary P-SEP levels and urinary P-SEP/creatinine ratio were compared in relation to eGFR and urinary WBC. IgAN,
IgA nephropathy; LN, lupus nephritis; DM diabetes mellitus; MCD, minimal change disease; MN, membranous
nephropathy; FSGS, focal segmental glomerulosclerosis; MPGN, membranoproliferative glomerulonephritis; CGN,
chronic glomerulonephritis; rs, Spearman’s rank correlation coefficient. *, p<0.05.
Reference
- Shirakawa K, Naitou K, Hirose J, et al. Presepsin (sCD14-ST): Development and evaluation of one-step ELISA with a new standard that is similar to the form of presepsin in septic patients. Clin Chem Lab Med. 2011; 49(5): 937-9. doi:10.1515/CCLM.2011.145PubMed
- De Haas CJC, Van Leeuwen HJ, Verhoef J, et al. Analysis of lipopolysaccharide (LPS)-binding characteristics of serum components using gel filtration of FITC-labeled LPS.
J Immunol Methods. 2000; 242(1-2): 79-89. doi:10.1016/S0022-1759(00)00207-6PubMed - Arai Y, Mizugishi K, Nonomura K, et al. Phagocytosis by human monocytes is required for the secretion of presepsin. J Infect Chemother. 2015; 21(8): 564-9. doi:10.1016/J.JIAC.2015.04.011PubMed
- Ikegame A, Kondo A, Kitaguchi K, et al. Presepsin production in monocyte/macrophage-mediated phagocytosis of neutrophil extracellular traps. Sci Reports. 2022; 12(1): 5978. doi:10.1038/s41598-022-09926-yPubMed
- Yaegashi Y, Shirakawa K, Sato N, et al. Evaluation of a newly identified soluble CD14 subtype as a marker for sepsis. J Infect Chemother. 2005; 11(5): 234-8. doi:10.1007/S10156-005-0400-4PubMed
- Shozushima T, Takahashi G, Matsumoto N, et al. Usefulness of presepsin (sCD14-ST) measurements as a marker for the diagnosis and severity of sepsis that satisfied diagnostic criteria of systemic inflammatory response syndrome. J Infect Chemother. 2011; 17(6): 764-9. doi:10.1007/S10156-011-0254-XPubMed
- Endo S, Suzuki Y, Takahashi G, et al. Presepsin as a powerful monitoring tool for the prognosis and treatment of sepsis: A multicenter prospective study. J Infect Chemother. 2014; 20(1): 30-4. doi:10.1016/J.JIAC.2013.07.005PubMed
- Zhang X, Liu D, Liu YN, et al. The accuracy of presepsin (sCD14-ST) for the diagnosis of sepsis in adults: A meta-analysis. Crit Care. 2015; 19(1): 323. doi:10.1186/s13054-015-1032-4PubMed
- Wu J, Hu L, Zhang G, et al. Accuracy of presepsin in sepsis diagnosis: A systematic review and meta-analysis. PLoS One. 2015; 10(7): e0133057. doi:10.1371/JOURNAL.PONE.0133057PubMed
- Zheng Z, Jiang L, Ye L, et al. The accuracy of presepsin for the diagnosis of sepsis from SIRS: A systematic review and meta-analysis. Ann Intensive Care. 2015; 5(1): 48. doi:10.1186/S13613-015-0089-1PubMed
- Watanabe N, Ishii T, Kita N, et al. The usefulness of pleural fluid presepsin, C-reactive protein, and procalcitonin in distinguishing different causes of pleural effusions. BMC Pulm Med. 2018; 18(1): 176. doi:10.1186/S12890-018-0740-3PubMed
- Imagama T, Tokushige A, Seki K, et al. Early diagnosis of septic arthritis using synovial fluid presepsin: A preliminary study. J Infect Chemother. 2019; 25(3): 170-4. doi:10.1016/J.JIAC.2018.10.015PubMed
- Imagama T, Seki K, Seki T, et al. Synovial fluid presepsin as a novel biomarker for the rapid differential diagnosis of native joint septic arthritis from crystal arthritis. Int J Infect Dis. 2021; 102: 472-7. doi:10.1016/J.IJID.2020.10.030PubMed
- Stubljar D, Kopitar AN, Groselj-Grenc M, et al. Diagnostic accuracy of presepsin (sCD14-ST) for prediction of bacterial infection in cerebrospinal fluid samples from children with suspected bacterial meningitis or ventriculitis. J Clin Microbiol. 2015; 53(4): 1239-44. doi:10.1128/JCM.03052-14PubMed
- Runyon BA, Montano AA, Akriviadis EA, et al. The serum-ascites albumin gradient is superior to the exudate-transudate concept in the differential diagnosis of ascites. Ann Intern Med. 1992; 117(3): 215-20. doi:10.7326/0003-4819-117-3-215PubMed
- Viallon A, Zeni F, Pouzet V, et al. Serum and ascitic procalcitonin levels in cirrhotic patients with spontaneous bacterial peritonitis: Diagnostic value and relationship to pro-inflammatory cytokines. Intensive Care Med. 2000; 26(8): 1082-8. doi:10.1007/S001340051321PubMed
- Elsadek HM, Elhawari SA, Mokhtar A. A novel serum index for accurate diagnosis of spontaneous bacterial peritonitis in cirrhotic patients without other infections. Egypt Liver J. 2020; 10(1): 10. doi:10.1186/S43066-020-0021-8
- Kotera A, Sagishima K, Tashiro T, et al. A validation of presepsin levels in kidney dysfunction patients: four case reports. J intensive care. 2014; 2(1): 63. doi:10.1186/S40560-014-0063-2PubMed
- Chenevier-Gobeaux C, Trabattoni E, Roelens M, et al. Presepsin (sCD14-ST) in emergency department: The need for adapted threshold values? Clin Chim Acta. 2014; 427: 34-6. doi:10.1016/J.CCA.2013.09.019PubMed