Noriyuki Kuroda, PhD*1, Koji Fujita, MD, PhD*2, Hitomi Imachi, MD, PhD*1,3,
Joji Tani, MD, PhD*2, Asahiro Morishita, MD, PhD*2, Kyoko Oura, MD, PhD*2, Tomoko Tadokoro, MD, PhD*2, Hideki Kobara, MD, PhD*2, Koji Murao, MD, PhD*1,3, Masafumi Ono, MD, PhD*2, Tsutomu Masaki, MD, PhD*2
Cite
Kuroda N, Fujita K, Imachi H, Tani, J, Morishita A, Oura K, Tadokoro T, Kobara H, Murao K, Ono M, Masaki T. The utility of the enhanced liver fibrosis (ELF)score in Japanese patients with chronic hepatitis or cirrhosis. Lab Med Int 2025; 4(1): 8-20. doi: 10.51041/lmi.4.1_8
Original
Lab Med Int 2025; 4(1): 8-20
Correspondence: Division of Clinical Laboratory, Department of Medical Technology, Kagawa University Hospital, Ikenobe, 1750-1, Miki, Kita, Kagawa 761-0793, Japan.
E-mail: Kuroda.noriyuki. j5″@” kagawa-u.ac.jp
Received March 25, 2024; accepted September 6, 2024
*1 Division of Clinical Laboratory, Department of Medical Technology, Kagawa University Hospital
*2 Department of Gastroenterology and Neurology, Faculty of Medicine, Kagawa University
*3 Department of Endocrinology and Metabolism, Faculty of Medicine, Kagawa University
ABSTRACT
Objectives: The ELF scores, a non-invasive serum marker for liver fibrosis, has primarily been utilized in Western countries as an alternative to liver biopsy. In this study, we assessed its diagnostic efficacy in Japanese patients by comparing it with other biomarkers.
Methods: We included 122 patients with chronic liver disease or cirrhosis who underwent liver biopsy. ELF scores, calculated for each fibrosis stage(F0-F4)based on the New Inuyama Classification, were compared with platelet count, aspartate aminotransferase-to-platelet ratio index(APRI), fibrosis-4 index, Mac-2-binding protein glycan isomer(M2BPGi)levels, and autotaxin(ATX)levels.
Results: ELF scores exhibited the highest correlation with fibrosis stages determined by liver biopsy(ρ=0.741, P<0.001)compared to other biomarkers. ELF scores increased with the development of fibrosis, and were higher in F1 than in F0(P=0.0062)and in F2 than in F1(P=0.0223). The area under the curve(AUC)values for the ELF scores were 0.913, 0.890, 0.870, and 0.850 for ≥F1, ≥F2, ≥F3, and ≥F4, respectively. The AUC values of ELF scores were comparable to those of M2BPGi levels across all stages, surpassing ATX levels for ≥F1, and outperforming other markers for both ≥F1 and F2 stages. ELF scores exhibited high specificity(94.44%)for ≥F1. For ≥F2, sensitivity was 83.82%, specificity 81.48%. Both ≥F3 and ≥F4 demonstrated high sensitivity(86.96% and 90.00%, respectively).
Conclusions: The ELF score, which strongly correlated with liver fibrosis, is particularly useful for diagnosing mild and moderate chronic hepatitis in Japanese patients and has the potential to rule out advanced liver fibrosis.
〔Lab Med Int 2025; 4(1): 8-20〕
Key Words
liver fibrosis, enhanced liver fibrosis score(ELF), Mac-2 binding protein glycosylation isomer(M2BPGi), autotaxin(ATX), noninvasive biomarkers
I. Introduction
Hepatic fibrosis progression is strongly associated with the prognosis of chronic liver disease and increases the risk of esophageal varices and carcinogenesis 1)2). Histological evaluation by liver biopsy has been the gold standard for assessing liver fibrosis; however, it is an invasive procedure 3)4) and there are reports of significantly different inter-observer assessments 5)6). It is difficult to repeat liver biopsies to observe changes in hepatic fibrosis. Therefore, noninvasive evaluation methods such as serum biomarker analysis and diagnostic imaging are used to detect the fibrosis stage 7)–9). The enhanced liver fibrosis score (ELF score) was originally determined by Rosenberg et al. 10), based on age, tissue inhibitor of metalloproteinases 1 (TIMP-1), amino-terminal propeptide of type III procollagen (PIIIP), and serum hyaluronic acid (HA); it was shown to correlate with the progression of liver fibrosis as determined by liver biopsy 10). The utility of the ELF score based on three fibrosis markers excluding age has been previously reported and is commonly used in clinical practice 11).
However, to date, the ELF scores have been primarily evaluated in European and American populations. In February 2024, the ELF score was incorporated into the insurance coverage framework in Japan. However, awareness among the population is limited. This study aimed to validate the efficacy of the ELF score as a noninvasive marker for assessing liver fibrosis in the Japanese population by incorporating a comprehensive comparison with alternative markers. The utility of the ELF score for assessing liver fibrosis in Japanese individuals was confirmed by Seko et al.’s 2022 report on metabolic dysfunction associated steatotic liver disease (MASLD) patients 12). They compared the AUC values of the ELF score, Mac-2-binding protein glycan isomer (M2BPGi)13), and fibrosis-4 index (Fib-4)8) in Japanese MASLD patients, concluding that the ELF score is superior in diagnostic accuracy, comparable to other indices. We believe that further evaluation of the ELF score’s utility in Japanese individuals is necessary, and we attempted validation including liver fibrosis from more diverse etiologies. In addition to M2BPGi and Fib-4, we compared the ELF score with many more noninvasive fibrosis biomarkers. Here, we measured the ELF score in Japanese patients with chronic liver disease and cirrhosis who underwent liver biopsy and evaluated its usefulness in the diagnosis of liver fibrosis. To achieve this, we compared the ELF score with other noninvasive fibrosis biomarkers: platelet (PLT) count 14), aspartate aminotransferase to platelet ratio index (APRI)7), Fib-4 index, M2BPGi, and autotaxin (ATX)15).
II. Subjects and methods
Patients
Between April 2015 and March 2016, 122 patients with chronic liver disease and cirrhosis underwent liver biopsy and blood sampling at the Kagawa University Hospital (53 male, 69 female; the median age with interquartile ranges 〔IQRs〕, 65.0 〔54.0-74.3〕 years) were studied. We retrospectively examined patient case records. Based on the New Inuyama Classification 16), we determined the number of cases at various stages of liver fibrosis (F0, no fibrosis; F1, portal fibrous widening; F2, portal fibrous widening with bridging fibrosis; F3, bridging fibrosis plus lobular distortion; and F4, liver cirrhosis) as F0=18 cases; F1=36 cases; F2=22 cases; F3=16 cases, and F4=30 cases. Liver damage results from chronic hepatitis B (CHB), chronic hepatitis C (CHC), alcohol-associated liver disease, MASLD, autoimmune hepatitis (AIH), primary biliary cholangitis (PBC), PBC-AIH overlap syndrome, and unknown causes (unknown) (Table 1). This retrospective study was conducted in accordance with the principles of the Declaration of Helsinki and was approved by the Ethics Committee of the Faculty of Medicine of Kagawa University (approval Number: 2016-016). Informed consent was obtained from all individuals included in this study.
Examination methods
Blood samples were collected, and PLT count and aspartate aminotransferase (AST) and alanine aminotransferase (ALT) levels were measured on the day of blood collection. The serum samples were stored at −70ºC and subsequently used to measure HA, PIIIP, TIMP-1, M2BPGi levels, and ATX levels. The HA, PIIIP, and TIMP-1 serum concentrations (CHA, CPIIIP, and CTIMP-1 [ng/mL]) were measured with the ADVIA Centaur XP Immunoassay System (Siemens Healthcare Diagnostics K.K., Tokyo, Japan), which is based on the principle of chemiluminescent immunoassay (CLIA). For these assays, the measurement reagents were ADVIA Centaur®Hyaluronic Acid (HA), ADVIA Centaur®N-terminal Propeptide of TypeIII Procollagen (PIIINP), and ADVIA Centaur® Tissue Inhibitor of Metalloproteinase 1 (TIMP-1) (Siemens Healthcare Diagnostics K.K., Tokyo, Japan). The M2BPGi assay was performed using the automatic immunoassay system HISCL-800 (Sysmex Corporation Kobe, Japan) and a dedicated reagent HISCL M2BPGi assay kit (Sysmex Corporation, Kobe, Japan) based on the principles of chemiluminescent enzyme immunoassay (CLEIA). The M2BPGi value was expressed in terms of the cutoff index (COI). The ATX assay was performed using a specific two-site enzyme immunoassay with the AIA-2000 system (Tosoh, Tokyo, Japan) and a dedicated reagent E test「TOSOH」II (autotaxin) (Tosoh, Tokyo, Japan).
ELF score was calculated by the formula:
“ELF score = 2.278 + 0.851In × (CHA) + 0.751In × (CPIIIP) + 0.394 × In (CTIMP-1).”
The APRI was calculated using the formula:
“100 × (AST level/the upper limit of the normal value of AST [IU/L] / PLT [×109/L]” 7). The upper limit of normal AST level at our hospital was 35 IU/L.
The Fib-4 index was calculated by the formula:
“Age [years] × AST [IU/L] / PLT [×109/L] × (ALT [IU/L]1/2)” 8).
A pathologist made the histological diagnosis of liver biopsies based on the New Inuyama Classification 16).
ATX levels and ELF scores were evaluated both overall and separately for males and females because ATX levels reportedly sex differences 15).
Quality control
The quality controls for HA, PIIIP, and TIMP-1 were assessed using three controls with varying concentrations. The mean ± standard deviation (SD) and coefficient of variation (CV) for the three controls of HA were 18.79±0.78 ng/mL (CV 4.16%), 50.81±1.40 ng/mL (CV 2.75%), and 205.82±6.49 ng/mL (CV 3.16%), respectively. For PIIIP, the values were 2.05±0.05 ng/mL (CV 2.46%), 5.37±0.15 ng/mL (CV 2.81%), and 11.97±0.30 ng/mL (CV 2.52%), respectively. Similarly, for TIMP-1, the results were 90.74±2.71 ng/mL (CV 2.99%), 250.84±5.17 ng/mL (CV 2.06%), and 521.17±13.71 ng/mL (CV 2.63%), respectively.
Statistical analysis
Data were expressed as medians with interquartile ranges (IQRs). Nonparametric Steel–Dwass analysis was used for multiple comparisons between each group of liver fibrosis stages, and for underlying illness. Receiver operating characteristic (ROC) curves were used to evaluate the performance of the ELF score and other markers in the diagnosis of liver fibrosis. In addition, the area under the curve (AUC) with 95% confidence intervals (CI), sensitivity, specificity, positive predictive value (PPV), negative predictive value (NPV), positive likelihood ratio (LR+), and negative likelihood ratio (LR–) were calculated from the ROC. Comparisons of the AUC were performed using the chi-square test. The optimal cutoff value was defined as the point maximizing the Youden index (=max[sensitivity+specificity-1]). The Spearman’s rank correlation coefficient (ρ) was used for evaluating the correlation between liver fibrosis stages obtained from the biopsy and the individual fibrosis biomarkers (ELF score, PLT count, APRI, Fib-4 index, M2BPGi level, and ATX level). The impact of age on the ELF score was assessed by categorizing patients into two groups: those under 65 years of age and those 65 years and older at each stage of liver fibrosis. The ELF score values for these groups were then analysed for statistical significance using the Mann-Whitney U test. All statistical analyses were performed using JMP Pro 16 software (SAS Institute Inc., Cary, NC, USA). Statistical significance was defined as P< 0.05.
Table 1 Patient’ s characteristics.
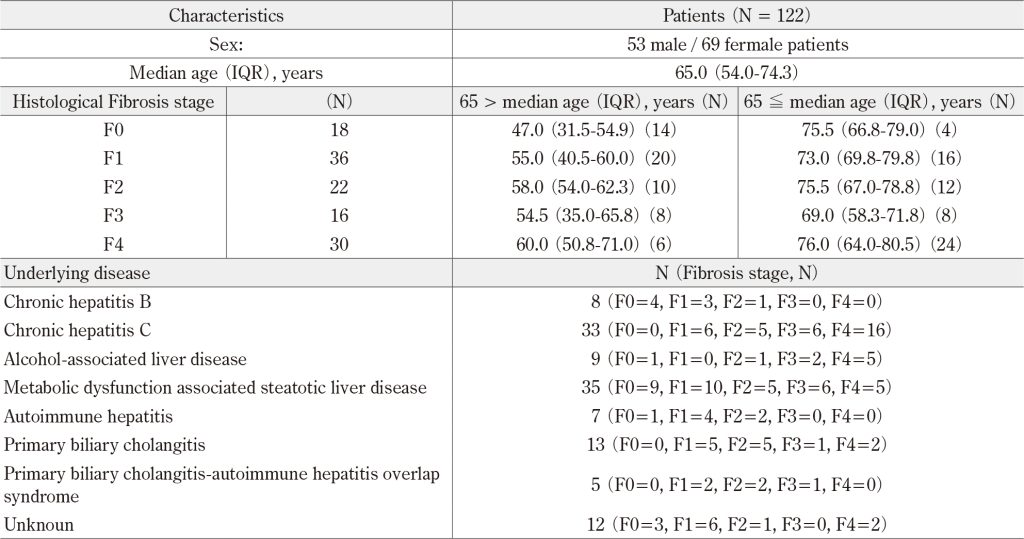
N: number of patients; SD: standard deviation; IQR: interquartile range
III. Results
Correlation between fibrosis stage determined by liver biopsy and six liver fibrosis markers: ELF score, PLT, APRI, Fib-4 Index, M2BPGi, and ATX
Table 2 shows the Spearman’s rank correlation coefficient between the fibrosis stages determined by liver biopsy and biomarkers. Each marker significantly correlated with the fibrosis stage. PLT counts declined with increasing stage, whereas all other counts increased. The correlation with fibrosis stage showed a strong correlation (ρ≥0.6), including ATX levels by sex, except for PLT and APRI. ELF scores exhibited the highest correlation overall (ρ=0.741, P <0.001) among other biomarkers.
Comparison of biomarkers according to liver fibrosis stage
A comparison of ELF scores according to liver fibrosis stages based on the New Inuyama Classification showed that the median (IQR) ELF scores were 8.84 (8.46–9.65), 9.89 (9.25–10.75), 10.92 (10.04–11.82), 11.55 (11.01–12.01), and 12.08 (11.36–12.64) for fibrosis stages F0, F1, F2, F3, and F4, respectively. The median ELF score increased with fibrosis development. The ELF scores were higher in the F1 stage than in the F0 stage (P=0.0062). These values were also higher in the F2 stage than in the F1 stage (P=0.0223). However, there was no significant difference between the F2 and F3 stages (P=0.5090) or between the F3 and F4 stages (P=0.3282) (Figure 1a).
Furthermore, the median PLT counts for fibrosis stages F0, F1, F2, F3, and F4 were 21.85 104/µL (18.20 104–24.80 104/µL), 20.70 104/µL (18.25 104–23.90 104/µL), 18.00 104/µL (15.25 104–23.40 104/µL), and 10.70 104/µL (7.48 104–14.68 104/µL), respectively (Figure 1b). The median PLT count decreased with the development of fibrosis. PLT counts were lower in F4 stage than in F3 stage (P=0.0265), whereas PLT counts were not significantly different between any other successive fibrosis stages. The median APRI values for fibrosis stages F0, F1, F2, F3, and F4 were 0.44 (0.31–0.87), 0.68 (0.46–1.13), 0.77 (0.49–1.71), 1.75 (1.02–2.18), and 1.16 (0.56–1.75), respectively (Figure 1c). The median APRI did not show a constant increase in one part of the fibrosis stage and did not show significant differences between any successive fibrosis stages. The median Fib-4 indices for the fibrosis stages F0, F1, F2, F3, and F4 were 1.37 (0.73–2.21), 2.19 (1.54–3.35), 2.80 (1.37–4.73), 3.98 (2.76–5.14), and 5.07 (3.53–8.42), respectively (Figure 1d). The median Fib-4 index increased with the development of fibrosis. The Fib-4 index did not show significant differences between successive fibrosis stages. The median M2BPGi levels for fibrosis stages F0, F1, F2, F3, and F4 were 0.66 COI (0.47–0.89 COI), 1.32 COI (0.69–2.08 COI), 1.76 COI (1.00–4.02 COI), 3.58 COI (1.51–4.23 COI), and 4.35 COI (2.43–7.47 COI), respectively (Figure 1e). The median M2BPGi levels increased with the development of fibrosis. M2BPGi levels were higher in F1 stage than in F0 stage (P=0.0112), whereas M2BPGi levels were not significantly different between any of the other successive fibrosis stages. The median ATX levels in overall for fibrosis stages F0, F1, F2, F3, and F4 were 0.88 mg/L (0.68–1.06 mg/L), 0.89 mg/L (0.74–1.11 mg/L), 1.32 mg/L (0.98–1.51 mg/L), 1.54 mg/L (1.21–2.02 mg/L), 1.62 mg/L (1.21–1.85 mg/L), respectively (Figure 1f). The median ATX levels increased with the development of fibrosis. ATX levels were higher in F2 stage than in F1 stage (P=0.0133), whereas ATX levels were not significantly different between any of the other successive fibrosis stages.
ELF scores and ATX levels among liver fibrosis stages by sex
The median ELF scores in males for fibrosis stages F0, F1, F2, F3, and F4 were 8.81 (7.92–9.68), 9.54 (8.97–10.72), 11.32 (10.65–11.74), 11.55 (10.99–12.01), and 11.88 (11.26–12.41), respectively (Figure 1g). The median ELF scores in females with fibrosis stages F0, F1, F2, F3, and F4 were 8.86 (8.58–9.62), 10.02 (9.49–10.81), 10.79 (10.01–12.01), 11.54 (10.89–12.10), and 12.33 (11.48–12.81), respectively (Figure 1i). The median ELF scores in males and females increased with the development of fibrosis. The median ATX levels in males for fibrosis stages F0, F1, F2, F3, and F4 were 0.72 mg/L (0.66–0.92 mg/L), 0.72 mg/L (0.59–0.77 mg/L), 0.87 mg/L (0.83–1.32 mg/L), 1.22 mg/L (1.14–1.49 mg/L), 1.62 mg/L (1.15–1.81 mg/L), respectively (Figure 1h). The median ATX levels in females for fibrosis stages F0, F1, F2, F3, and F4 were 0.94 mg/L (0.82–1.16 mg/L), 1.02 mg/L (0.89–1.22 mg/L), 1.36 mg/L (1.11–1.61 mg/L), 1.90 mg/L (1.43–2.11 mg/L), and 1.62 mg/L (1.34–1.87 mg/L), respectively (Figure 1j). The median ATX levels in both sexes did not show a constant increase at a single stage of fibrosis. When comparing the ELF scores and ATX levels for fibrosis stages in males and females, only the ELF scores in males between F0 and F1 showed a significant difference (P=0.0229).
Ability of ELF score to predict liver fibrosis
ROC analyses aimed to assess the diagnostic accuracy of the ELF scores for the fibrosis stages. Figure 2 illustrates the ROC curves of the ELF scores, while Table 3a displays the calculated values for the AUC, cutoff value, sensitivity, specificity, PPV, NPV, LR+, and LR− for each fibrosis stage. The AUC values were 0.913, 0.890, 0.870, and 0.850 for ≥F1, ≥F2, ≥F3, and ≥F4, respectively. The corresponding cutoff values for predicting fibrosis stages were 9.92, 10.64, 10.99, and 11.00, respectively. Notably, the cut-off values for fibrosis stages ≥F3 and ≥F4 were nearly identical. ELF scores exhibited high specificity (94.44%), PPV (98.80%), and LR+ (14.18) for ≥F1. For ≥F2, sensitivity was 83.82%, specificity 81.48%, PPV 85.07%, NPV 80.00%, LR+ 4.53, and LR- 0.20. Both ≥F3 and ≥F4 demonstrated high sensitivity (86.96% and 90.00%, respectively), high NPV (90.91% and 95.52%, respectively), and low LR− (0.17 and 0.14, respectively).
Comparison of fibrosis markers by AUC
Table 3a presents the AUC of the ELF score, PLT count, APRI, Fib-4 index, M2BPGi, and ATX for liver fibrosis stages, along with their corresponding values. The AUC of ELF scores for ≥F1 was significantly higher than PLT counts (AUC=0.703, P=0.0005), APRI (AUC=0.726, P=0.0076), Fib-4 index (AUC=0.809, P=0.0354), and ATX levels (AUC=0.785, P=0.0031) and comparable to M2BPFi levels (AUC=0.880, P=0.2184). Similar to the ELF scores, the Fib-4 index, M2BPGi levels, and ATX levels displayed high specificity, PPV, and LR+ for ≥F1. For ≥F2, the AUC of ELF scores was significantly higher than that of PLT counts (AUC=0.763, P=0.0109), APRI (AUC=0.679, P <0.0001), and Fib-4 index (AUC=0.803, P=0.0228), and comparable to M2BPFi levels (AUC=0.830, P=0.0600) and ATX levels (AUC=0.881, P=0.7734). ELF scores exhibited the highest sensitivity, the highest NPV, and the lowest LR- among the markers for ≥F2, while the specificity of APRI (84.62%), M2BPGi levels (88.89%), and ATX levels (87.50%) surpassed that of ELF scores. For fibrosis stages ≥F3 and ≥F4, the AUC of ELF scores was significantly higher than APRI but comparable to other biomarkers. ELF scores had the highest sensitivity, the highest NPV, and the lowest LR- among the markers for ≥F3, while specificity was similar to Fib4-index (79.45%) and M2BPGi levels (81.58%). For ≥F4, PLT counts (93.33%) and the Fib4-index (89.66%) showed comparable sensitivity to ELF scores. However, the cutoff values for PLT, APRI, Fib-4, M2BPGi, and ATX either exhibited nearly consistent values across stages or showed a reversal between stages.
Diagnostic ability of ELF score and ATX for predicting liver fibrosis stages by sex
Comparisons of the AUC between ELF scores and ATX levels in predicting fibrosis stage by sex are presented in Table 3b. For fibrosis stages ≥F1, the AUC of ELF scores was significantly higher than that of ATX levels in both males and females. ELF scores in both sexes and ATX levels in males were shown to have high specificity (100.00%) and PPV (100.00%) for ≥F1, whereas the specificity of ATX levels in females was 87.50%. For fibrosis stages ≥F2, ≥F3, and ≥F4, the AUC of ELF scores was comparable to that of ATX levels in both sexes. For ≥F2 in females, the specificity (92.86%) of ATX levels was higher than that of the ELF scores (81.25%). For ≥F2 in males, the sensitivity (92.00%) of ATX levels was higher than that of ELF scores (83.87%), and the specificity (90.00%) of ATX levels was similar to that of ELF scores (90.91%). For ≥F3 in females, the sensitivity (94.45%) of the ELF scores was higher than that of the ATX levels (73.68%). For ≥F3 in males, the sensitivity (100.00%) of ATX levels was higher than that of ELF scores (87.50%). Similarly, for ≥F4 in females, the sensitivity (100.00%) of ELF scores was higher than that of ATX levels (72.23%), and for ≥F4 in males, the sensitivity (93.75%) of ATX levels was higher than that of ELF scores (88.24%). However, the cut-off values for the ELF score and ATX in both sexes were almost indistinguishable between the stages.
Comparison of fibrosis markers and their etiologies
CHC group and MASLD group were analyzed independently, and CHB, alcohol-associated liver disease, AIH, PBC, PBC-AIH overlap syndrome, and unknown etiologies were grouped together as grouped categories. Figure 3 presents a comparison of marker values among the CHC group, MASLD group, and grouped categories in F1-F2 and F3-F4 stages, respectively. The median (IQR) ELF scores in F1-F2 and F3-F4 stages were 11.14 (10.91-11.54) and 11.87 (11.07-12.35) for the CHC group, 9.85 (9.18-10.65) and 11.99 (11.47-13.11) for the MASLD group, and 10.03 (9.48-10.79) and 12.01 (11.09-12.30) for grouped categories, respectively. Nonparametric Steel–Dwass analysis revealed that the ELF scores of the CHC group in the F1-F2 stages were significantly higher than those of the MASLD group (P = 0.0295) and the grouped categories (P = 0.0182). However, there was no significant difference between the MASLD group and the grouped categories (P = 0.8358). In the F3-F4 stages, the ELF scores did not show significant differences among any of the groups. Similarly, the M2BPGi levels in the CHC group during the F1-F2 stages were significantly elevated compared to the MASLD group (P = 0.0002) and the grouped categories (P = 0.0279). The grouped categories also exhibited significantly higher M2BPGi levels than the MASLD group (P = 0.0328). In contrast, no significant differences in M2BPGi levels were observed among any of the groups in the F3-F4 stages. For other markers, no significant differences were observed among the three etiological groups at either the F1-F2 or F3-F4 stages. Table 4 presents the AUC, cut-off values, sensitivity, specificity, PPV, and NPV of the ELF scores and M2BPGi across different stages of liver fibrosis within each of the three etiological groups. The AUC of the ELF scores were fair for CHC with fibrosis stages ≥F3 (AUC = 0.729) and ≥F4 (AUC = 0.739), but were otherwise good or excellent for all etiological groups, with AUC ranging from 0.809 to 0.936. The AUC of M2BPGi were fair for MASLD with fibrosis stage ≥F1 (AUC = 0.784), grouped categories with fibrosis stage ≥F2 (AUC = 0.749), and CHC with fibrosis stage ≥F3 (AUC = 0.773), but poor for CHC with fibrosis stage ≥F4 (AUC = 0.684). The AUC for all other etiological groups were good or excellent, ranging from 0.820 to 0.947. The cutoff value of the ELF scores, calculated using AUC, was higher in the CHC group compared to other groups for fibrosis stages ≥F2 to ≥F4. Specifically, the cutoff values for CHC, MASLD, and grouped categories were 11.57, 10.65, and 10.01, respectively, for stage ≥F2. The CHC group also had a higher cutoff value in M2BPGi compared to other groups. In the MASLD group, the ELF scores demonstrated high specificity for stage ≥F1 (88.89% for MASLD and 100% for grouped categories). For stage ≥F2, the sensitivity and specificity in MASLD were 81.25% and 94.74%, respectively, and for stage ≥F3, the sensitivity was 90.91% and specificity was 87.50%. In grouped categories, the sensitivity and specificity for stage ≥F2 were 92.00% and 72.41%, respectively, and for stage ≥F3, 100.00% and 78.05%. For stage ≥F4, both MASLD and the grouped categories demonstrated high sensitivity (100.00%). In contrast, the ELF scores for the CHC group exhibited lower sensitivities (59.09% to 62.50%) and higher specificities (82.35% to 100.0%) for stages ≥F2 to ≥ F4. Due to the large difference between the overall and CHC group cutoff values in the ELF scores at ≥F2, the sensitivity and specificity for CHC were calculated using the overall cutoff value (10.64), resulting in 92.59% and 16.67%, respectively. Additionally, because the difference between the overall and grouped categories cutoff values in the ELF scores at ≥F2 was larger than at other fibrosis stages, the sensitivity and specificity for each disease were compared using both the overall and grouped categories cutoff values. For ≥F2, the sensitivity/specificity for PBC and PBC-AIH overlap syndrome were 63.63%/100.00% using the overall cutoff (10.64) and 81.82%/100.00% using the grouped categories cutoff (10.01). Similarly, the sensitivity/specificity for AIH and PBC-AIH overlap syndrome, Unknown etiologies, CHB, and alcohol-associated liver disease were 80.00%/100.00% and 100.00%/71.43%, 100.00%/77.78% and 100.00%/55.56%, 100.00%/85.71% and 100.00%/85.71%, and 100.00%/100.00% and 100.00%/100.00%, respectively.
The impact of age on the ELF scores
The median (IQR) ELF scores for individuals under 65 years were 8.60 (7.93-9.66), 9.52 (9.02-10.74), 10.50 (9.76-11.66), 11.32 (11.01-10.91), and 12.34 (11.70-12.57) for fibrosis stages F0, F1, F2, F3, and F4, respectively. For those aged 65 years and older, the median (IQR) ELF scores were 9.62 (9.15-10.19), 10.29 (9.59-10.87), 11.45 (10.42-11.99), 11.77 (11.85-12.16), and 11.97 (11.32-12.69) for the corresponding fibrosis stages. There was no significant difference in the median ELF scores between the under 65 and 65 and older groups at any stage of liver fibrosis (P=0.1419 for F0, P=0.0887 for F1, P=0.1593 for F2, P=0.5054 for F3, P=0.6674 for F4).
Table 2 Correlation between fibrosis stage by liver biopsy and biochemical markers of hepatic fibrosis.
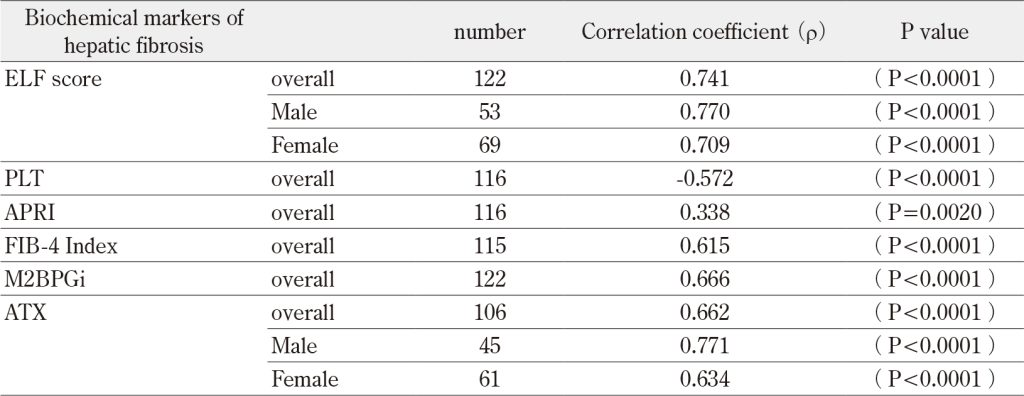
ELF score: enhanced liver fibrosis score; PLT: platelet count; APRI: aspartate aminotransferase to platelet ratio index; M2BPGi: Mac-2 binding protein glycosylation isomer; ATX: autotaxin. The Spearman’ s rank correlation coefficient (ρ) was used for evaluating the correlation between liver fibrosis stages and the individual fibrosis biomarkers.
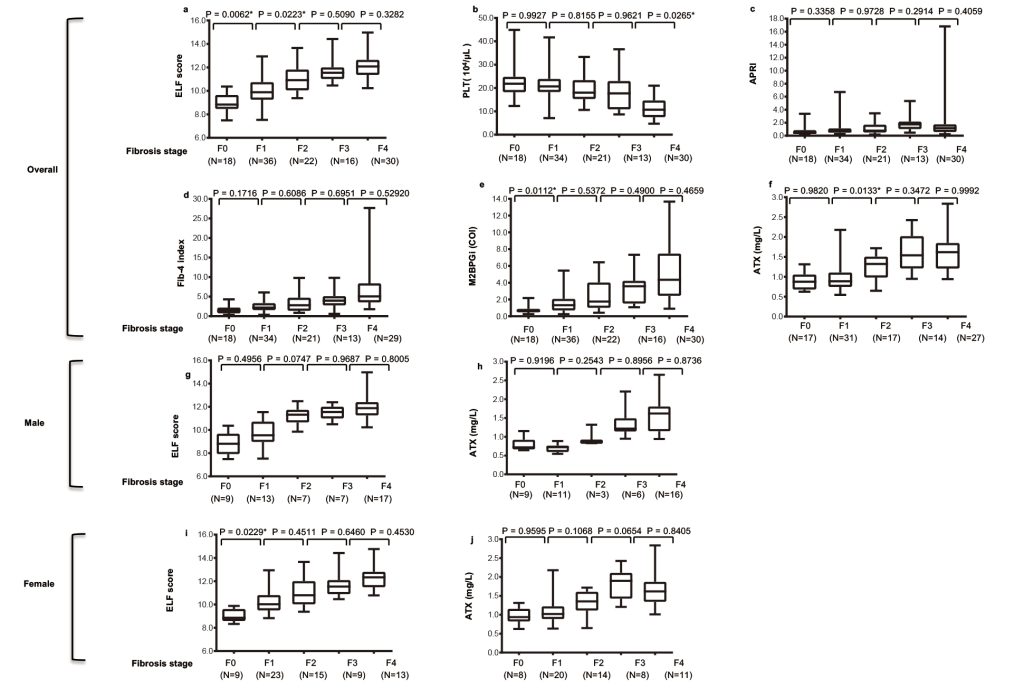
Figure 1 Comparison of biomarkers according to liver fibrosis stage. Overall: (a) ELF score, (b) PLT, (c) APRI, (d) Fib4-index, (e) M2BPGi, and (f) ATX. Male: (g) ELF score, (h) ATX. Female: (i) ELF score, (j) ATX. (g) to (j) are ELF scores and ATX levels comparisons by sex. ELF score: enhanced liver fibrosis score; PLT: platelet count; APRI: aspartate aminotransferase to platelet ratio index; M2BPGi: Mac-2 binding protein glycosylation isomer; ATX: autotaxin; P-value*:<0.05.
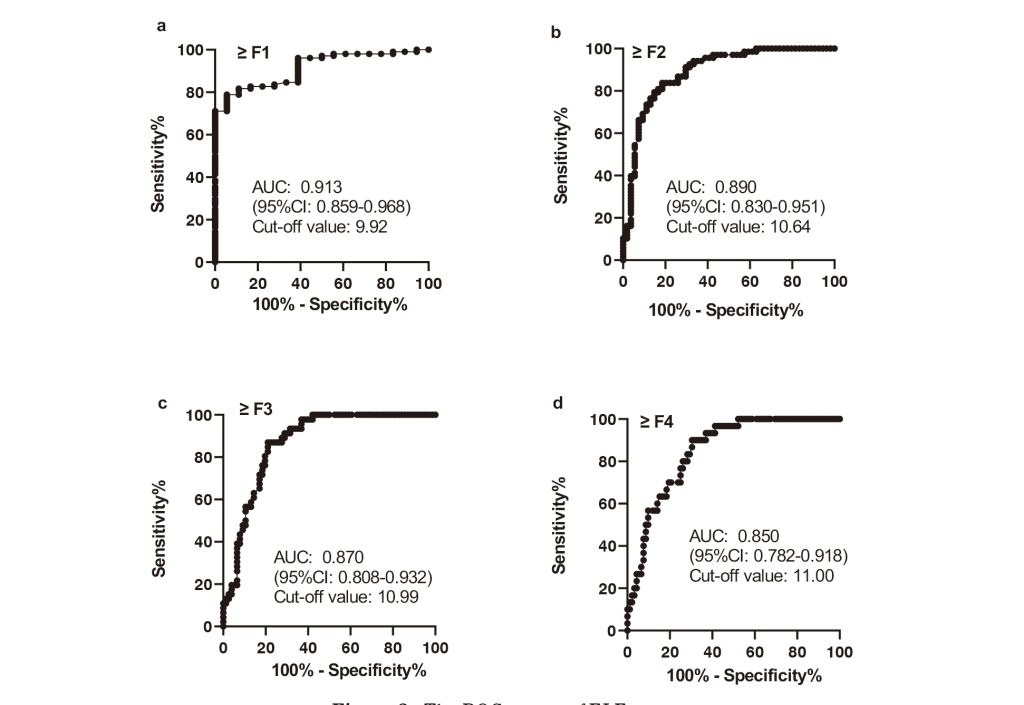
Figure 2 The ROC curves of ELF scores. (a) For ≥ liver fibrosis stage F1, (b) for ≥ F2, (c) for ≥ F3, and (d) for ≥ F4. ROC: receiver operating characteristic; AUC: area under the curve; CI: confidence interval. The cutoff value was defined as the point maximizing the Youden index.
Table 3a Diagnostic performance of fibrosis biochemical markers in overall.
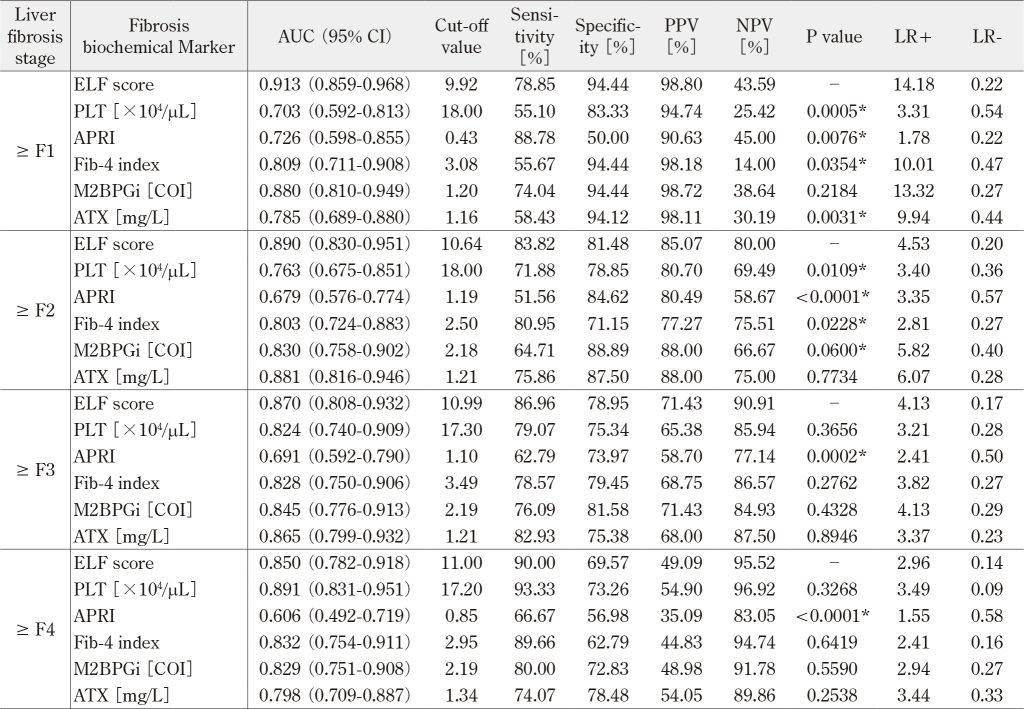
CI: confidence interval; PPV: positive predictive value; NPV: negative predictive value; LR+: positive likelihood ratio; LR-: negative likelihood ratio; ELF score: enhanced liver fibrosis score; PLT count: platelet count; APRI: aspartate aminotransferase to platelet ratio index; M2BPGi: Mac-2 binding protein glycosylation isomer; ATX: autotaxin; P value: the AUC of ELF score versus that of other fibrosis marker, and P value*: < 0.05.
Table 3b Diagnostic performance of ELF score and ATX by sex.
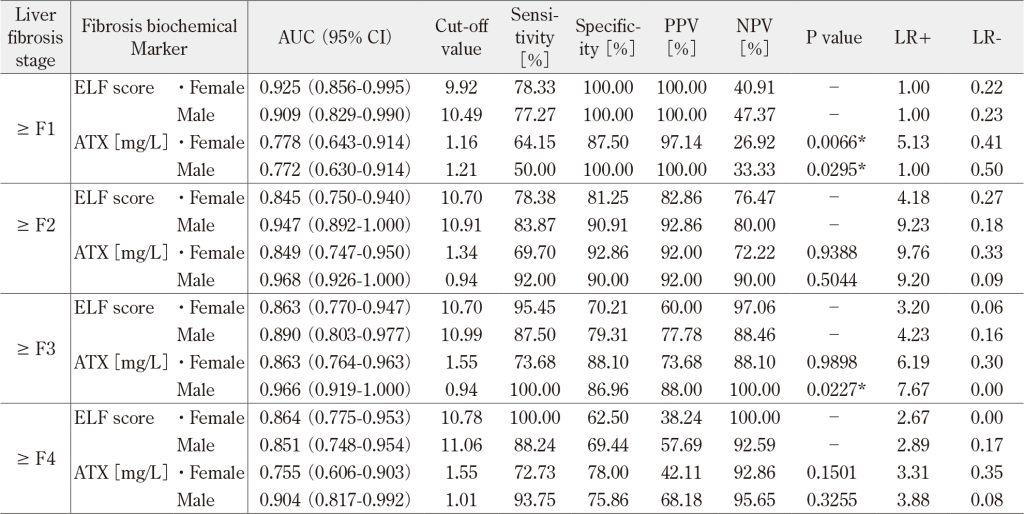
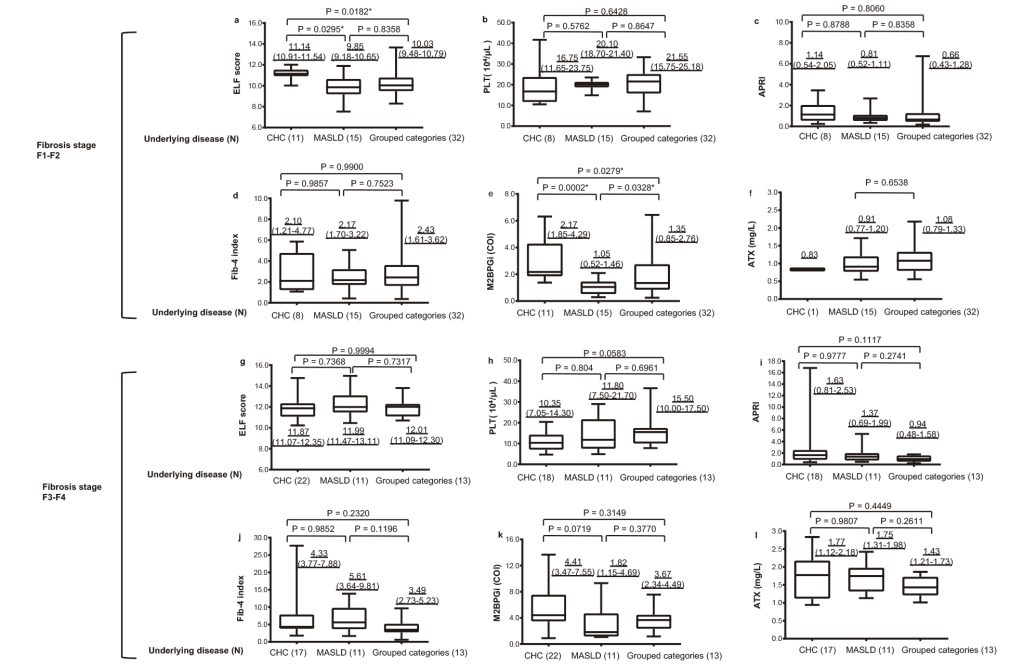
Figure 3 Comparison of fibrosis markers and their etiologies Fibrosis stage F1 -F2: (a) ELF score, (b) PLT, (c) APRI, (d) Fib4-index, (e) M2BPGi, and (f) ATX. Fibrosis stage F3 -F4: (g) ELF score, (h) PLT, (i) APRI, (j) Fib4-index, (k) M2BPGi, and (l) ATX. ELF score: enhanced liver fibrosis score; PLT: platelet count; APRI: aspartate aminotransferase to platelet ratio index; M2BPGi: Mac-2 binding protein glycosylation isomer; ATX: autotaxin; CHC: chronic hepatitis C; MASLD: metabolic dysfunction associated steatotic liver disease; P-value*:<0.05. CHB, alcohol-associated liver disease, AIH, PBC, PBC-AIH overlap syndrome, and unknown etiologies were grouped together as grouped categories. The underlined numbers in the figure indicate the median and interquartile ranges of the marker for each underlying disease.
Table 4 Diagnostic performance of ELF score and M2BPGi within each of the three etiological groups
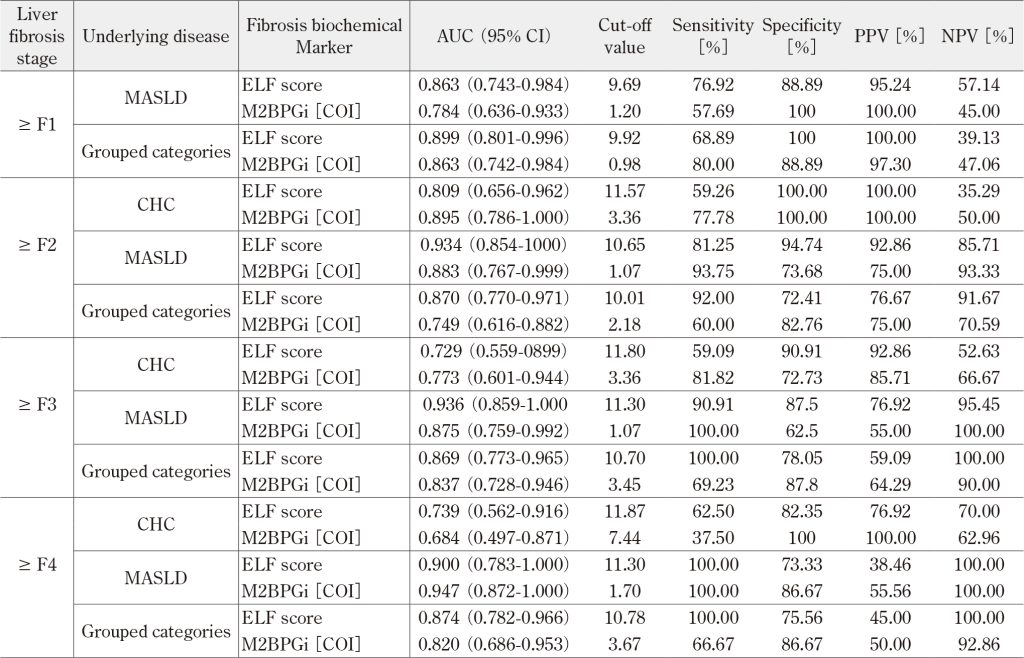
AUC: area under the curve; CI: confidence interval; PPV: positive predictive value; NPV: negative predictive value; ELF score: enhanced liver fibrosis score; M2BPGi: Mac-2 binding protein glycosylation isomer; CHC: chronic hepatitis C; MASLD: metabolic dysfunction associated steatotic liver disease. CHB, alcohol-associated liver disease, AIH, PBC, PBC-AIH overlap syndrome, and unknown etiologies were grouped together as grouped categories. The cutoff value was defined as the point maximizing the Youden index.
IV. Discussion
In the present study of a sample of Japanese patients with liver disease, we evaluated ELF scores for the diagnosis of the stage of liver fibrosis and compared ELF scores with other noninvasive fibrosis markers such as PLT counts 14), APRI 7), Fib-4 index 8), M2BPGi levels 13), and ATX levels 15). ELF scores had the highest correlation coefficient with liver fibrosis among other biomarkers (ρ=0.741, P<0.001). The ELF score could distinguish the fibrosis stages more clearly than the other biomarkers. ELF scores showed high AUC (≥0.8) at all stages, and good diagnostic ability was obtained. Using the AUC method, the ELF score could be used to detect mild (F1) liver fibrosis with high specificity (94.44%) and to exclude severe/cirrhotic (F3-F4) liver fibrosis with high sensitivity (86.96%). This suggests that the ELF score is an alternative marker for distinguishing mild or severe liver fibrosis and is a better marker than other noninvasive markers.
Overall, ELF scores showed the highest correlation with the fibrosis stage among other biomarkers. A previous study also reported a strong correlation between ELF scores and histological fibrosis in PBC patient was strong 17). These facts suggest that ELF scores most accurately reflect liver fibrosis among other noninvasive biomarkers.
The overall median ELF scores, Fib-4 index, M2BPGi levels, and total ATX levels tended to increase, while PLT counts decreased with the progression of liver fibrosis. Among the successive fibrosis stages, the ELF scores were significantly different only between the F0 and F1 stages and between the F1 and F2 stages. The ability of ELF scores to distinguish the early stages of fibrosis suggests their clinical utility in identifying patients at different risk levels. There was no significant difference between the F2 and F3 stages or between the F3 and F4 stages. However, a previous study in Japanese patients reported that ELF scores increased with the development of liver fibrosis and showed significant differences among all fibrosis stages (P <0.05)18). This discrepancy may be attributed to the small sample size used in this study. However, among other markers, only PLT counts (F3-F4), M2BPGi level (F0-F1), and total ATX level (F1-F2) could significantly differentiate between the fibrosis stages. These results suggest that the ELF score can more clearly distinguish the early stages of fibrosis than other markers, but PLT counts can more clearly distinguish cirrhosis than other markers.
When comparing ELF scores and ATX levels for liver fibrosis stages, these were evaluated separately for males and females, as there are sex differences in ATX levels 15). In both sexes, the median ELF scores increased with the progression of liver fibrosis; however, the median ATX levels did not consistently increase with the development of fibrosis at any stage. In the analysis of ELF scores and ATX levels across liver fibrosis stages by sex, there were no significant differences between males, except for the ELF scores between F0 and F1. In previous studies, ATX levels were observed to increase with the progression of liver fibrosis in both males and females, with significant differences between each stage 19).
We assessed the diagnostic accuracy of ELF scores for predicting various fibrosis stages and compared them with those of other fibrosis markers using AUC. ELF scores demonstrated excellent diagnostic accuracy for identifying fibrosis stages ≥F1, ≥F2, and ≥F3, with AUC values of 0.913, 0.890, and 0.870, respectively. The AUC for ≥F4 was good at 0.850. The consistently high AUC values suggest that ELF scores are effective in distinguishing between the different fibrosis stages. ELF scores demonstrated high specificity, PPV and LR+ for ≥F1, suggesting that ELF scores are particularly reliable in the definitive diagnosis of mild (F1) liver fibrosis. For ≥F2, ELF scores had a balanced sensitivity and specificity. This balance is crucial for accurate identification of patients with moderate fibrosis. For ≥F3 and ≥F4, the ELF scores showed high sensitivity and NPV. These findings suggested their effectiveness in ruling out advanced fibrosis and cirrhosis. Previous studies have shown that the ELF score has accurate diagnostic performance in CHC, MASLD, and PBC cases in European and American populations 20)-22). In Japan, Seko et al. reported that in a study of 371 Japanese patients with MASLD, the AUC of the ELF scores for stages ≥F1, ≥F2, ≥F3, and ≥F4 were 0.825, 0.817, 0.802, and 0.812, respectively 12).
ELF scores showed significantly higher AUC values for ≥F1 than for PLT counts, APRI, Fib-4 index, and ATX levels. Similar AUC values were observed compared to the M2BPGi levels. For ≥F2, ELF scores had significantly higher AUC than PLT counts, APRI, and Fib-4 index, and similar AUC to M2BPGi levels and ATX levels. For ≥F3 and ≥F4, the ELF scores had AUC values comparable to those of the other biomarkers, except for APRI. ELF scores had the highest sensitivity among the markers for ≥F2 and ≥F3, emphasizing their ability to detect moderate and advanced fibrosis. These results suggest that ELF scores are strong predictors of liver fibrosis, especially in the moderate to advanced stages. The ELF scores outperformed or showed a similar performance to other fibrosis markers, indicating their reliability in clinical practice. ELF scores, with their high sensitivity and specificity, may be valuable in noninvasive fibrosis assessment and could aid in clinical decision-making, reducing reliance on invasive procedures, such as liver biopsy. In this study, the AUC of ELF scores and M2BPGi levels were comparable. However, the cut-off value of M2BPGi levels remained nearly constant from F2 to F4, rendering it impractical for clinical use. A previous study reported that the ELF score and M2BPGi level exhibited nearly equivalent performances in ROC analysis among patients with hepatitis B. However, variations in performance were observed based on the chosen cutoff value 23).
The AUC of the ELF scores for predicting ≥F1 was significantly higher than that of the ATX levels in both males and females. This suggests that the ELF scores are more effective in distinguishing the early stages of fibrosis in both sexes. The AUC of ELF scores for ≥F2, ≥F3, and ≥F4 were comparable to that of ATX levels in both males and females. This implies that ELF scores and ATX levels have similar diagnostic accuracies in identifying moderate fibrosis, advanced fibrosis, and cirrhosis. ELF scores generally outperform ATX levels in predicting early fibrosis stages (≥F1) in both sexes, while their performance becomes comparable in advanced stages. In this study, the cutoff values for ELF scores and ATX levels in both sexes were nearly identical for every fibrosis stage and were deemed impractical for clinical use. In previous studies, the cutoff values for ATX levels in both sexes showed clear differences between each stage, increasing with the progression of liver fibrosis stages 19).
In this study, a range of underlying diseases was included, necessitating an examination of their influence on the observed parameters. Notably, the impact of these diseases was evident in the ELF scores and M2BPGi levels during the early stages of fibrosis (F1-F2). Specifically, the CHC group demonstrated significantly higher values compared to other disease groups. ELF scores and M2BPGi values may vary depending on the specific underlying disease.
When evaluating the AUC by segregating the CHC group, MASLD group, and other grouped categories, the ELF scores were favorable across all disease categories. Seko et al. reported that the AUC was 0.8 or higher across all stages of liver fibrosis in patients with MASLD, which aligns with our findings. Additionally, they identified the cut-off values of the ELF test for fibrosis stages ≥F1, ≥F2, ≥F3, and ≥F4 as 9.10, 10.11, 11.10, and 11.54, respectively, which are consistent with our results of 9.69, 10.65, 11.30, and 11.30 12). For both the ELF scores and M2BPGi levels, the cutoff values determined by AUC for the CHC group were higher at each fibrosis stage compared to the overall cohort and other disease groups. Using an overall ELF score cutoff value of ≥F2 for the CHC group results in low specificity, leading to a high number of false positives. Therefore, it is challenging to apply the overall cutoff value of the ELF score to the CHC group. The MASLD group and other grouped categories demonstrated high specificity for fibrosis stages ≥ F1, with overall trends showing similar specificity. For stages ≥F2, both sensitivity and specificity were comparable across the groups, aligning with the overall trends. Additionally, they tended to exhibit high sensitivity for stages ≥F3 and ≥F4. However, this pattern was not observed in the CHC group. When comparing the sensitivity and specificity of each disease within the grouped categories for fibrosis stage ≥F2 using both the overall cutoff values and the cutoff values obtained for the grouped categories, the following observations were made: In the PBC group, the cutoff values obtained for the grouped categories demonstrated higher sensitivity. However, in the AIH group and the unknown group, the grouped categories exhibited lower specificity. No other major differences were noted.
To evaluate the impact of age on ELF scores, we analyzed the ELF scores of patients under 65 years and those over 65 years at each fibrosis stage. No significant differences were found at any stage, indicating that age does not have a significant influence on ELF scores.
This study had several limitations. The small sample sizes may have contributed to the lack of significant differences between successive fibrosis stages and the indistinguishable cutoff values for some markers across stages. Larger studies are required to validate these findings. Future studies should investigate the utility of ELF scores in diagnosing advanced liver fibrosis or cirrhosis. The participants had various etiologies of liver fibrosis, which might have influenced the ELF scores. Future studies should evaluate the usefulness of ELF scores for individual etiologies.
V. Conclusion
In conclusion, ELF scores demonstrated the highest correlation with liver fibrosis stages among noninvasive biomarkers and provided excellent diagnostic accuracy for identifying fibrosis stages. They were particularly effective in distinguishing early fibrosis stages and showed high sensitivity and specificity for advanced stages. Despite some limitations, ELF scores outperformed or showed comparable performance to other fibrosis markers, making them a reliable tool in clinical practice for noninvasive fibrosis assessment. Future studies with larger sample sizes and focused on specific etiologies are warranted to further validate these findings and expand the clinical utility of ELF scores in liver fibrosis diagnosis.
Declaration of competing interests: None declared.
Author Contributions: NK, KF and TM conceived the study concept and design. KF obtained approval from the Ethics Committee. KF, JT, AM, KO, TT, HK, and TM were involved in patient recruitment and data acquisition. NK was involved in data acquisition and analysis, and drafted the manuscript. TM supervised the study. All authors reviewed and revised the manuscript, and approved the final version.
Informed consent: Informed consent was obtained from all individuals included in this study. For patients who died and had no relatives listed in their clinical records, we provided opt-out methods for the relatives of the dead participants by publishing a summary of this study on our university website.
Ethical approval: This study was approved by the authors’ Institutional Review Board (The Ethics Committee, Faculty of Medicine, Kagawa University) dated June 1st, 2016 (approval number: 2016-016). It complied with all relevant national regulations and institutional policies, and was in accordance with the tenets of the Helsinki Declaration (as revised in 2013).
Disclosure of Conflicts of Interest: The authors declare no conflicts of interest associated with this manuscript.
Funding: This work was financially supported by the Sysmex Corporation (Kobe, Japan) and Siemens Healthcare Diagnostics K.K. (Tokyo, Japan).
Acknowledgements: We thank Editage (www.editage.com) for English language editing.
References
- Tada T, Kumada T, Toyoda H, et al. Long-term prognosis of patients with chronic hepatitis C who did not receive interferon-based therapy: causes of death and analysis based on the FIB-4 index. J Gastroenterol 2016; 51(4): 380-9.PubMed
- Angulo P, Kleiner DE, Dam-Larsen S, et al. Liver fibrosis, but no other histologic features, is associates with long-term outcomes of patients with nonalcoholic fatty liver disease. Gastroenterology 2015; 149(2): 389-97.PubMed
- Van der Poorten D, Kwok A, Lam T, et al. Twenty-year audit of percutaneous liver biopsy in a major australian teaching hospital. Intern Med J 2006; 36(11): 692-9.PubMed
- Cadranel JF, Rufat P, Degos F. Practices of liver biopsy in France: results of a prospective natiowide survey. For the group of epidemiology of the french association for the study of the liver (AFEF). Hepatology 2000; 32(3): 477–81.PubMed
- Regev A, Berho M, Jeffers LJ, et al. Sampling error and intraobserver variation in liver biopsy in patients with chronic HCV infection. Am J Gastroenterol 2002; 97:2614–8.PubMed
- Rousselet MC, Michalak S, Dupré F, et al. Sources of variability in histological scoring of chronic viral hepatitis. Hepatology 2005; 41(2): 257-64.PubMed
- Wai CT, Greenson JK, Fontana RJ, et al. A simple noninvasive index can predict both significant fibrosis and cirrhosis in patients with chronic hepatitis C. Hepatology 2003; 38(2): 518-26.PubMed
- Vallet-Pichard A, Mallet V, Nalpas B, et al. FIB-4: an inexpensive and accurate marker of fibrosis in HCV infection. Comparison with liver biopsy and fibrotest. Hepatology 2007; 46(1): 32-6.PubMed
- Yoshioka K, Hashimoto S. Can non-invasive assessment of liver fibrosis replace liver biopsy? Hepatol Res 2012; 42(3): 233-40.PubMed
- Rosenberg WM, Voelker M, Thiel R, et al. Serum markers detect the presence of liver fibrosis: a cohort study. Gastroenterology 2004; 127(6): 1704-13.PubMed
- Guha IN, Parkes J, Roderick P, et al. Noninvasive markers of fibrosis in nonalcoholic fatty liver disease: validating the european liver fibrosis panel and exploring simple markers. Hepatology 2008; 47(2): 455-60.PubMed
- Seko Y, Takahashi H, Toyoda H, et al. Diagnostic accuracy of enhanced liver fibrosis test for nonalcoholic steatohepatitis-related fibrosis: Multicenter study. Hepatol Res 2022; 53(4): 312-21.PubMed
- Kuno A, Ikehara Y, Tanaka Y, et al. A serum “sweet-doughnut” protein facilitates fibrosis evaluation and therapy assessment in patients with viral hepatitis. Sci Rep 2013; 3: 1065.PubMed
- Afdhal N, McHutchison J, Brown R, et al. Thrombocytopenia associated with chronic liver disease. J Hepatol 2008; 48(6): 1000-7.PubMed
- Pleli T, Martin D, Kronenberger B, et al. Serum autotaxin is a parameter for the severity of liver cirrhosis and overall survival in patients with liver cirrhosis –– a prospective cohort study. Plos One 2014; 9(7): e103532.PubMed
- Ichida F, Tsuji T, Omata M, et al. New Inuyama classification; new criteria for histological assessment of chronic hepatitis. International Hepatology Communications 1996; 6(2): 112-9.
- Mayo MJ, Parkes J, Adams-Huet B, et al. Prediction of clinical outcomes in primary biliary cirrhosis by serum enhanced liver fibrosis assay. Hepatology 2008; 48(5): 1549-57. PubMed
- Takashima T, Iijima H, Aoki T, et al. Usefulness of liver fibrosis markers ELF in chronic hepatitis. Kanzo 2015; 56(10): 543-5.
- Yamazaki T, Joshita S, Umemura T, et al. Association of serum autotaxin levels with liver fibrosis in patients with chronic hepatitis c. Sci Rep 2017; 7: 46705.PubMed
- Parkes J, Guha IN, Roderick P, et al. Enhanced liver fibrosis (ELF) test accurately identifies liver fibrosis in patients with chronic hepatitis C. J Viral Hepat 2011; 18(1): 23-31.PubMed
- Mayo MJ, Parkes J, Adams-Huet B, et al. Prediction of clinical outcomes in primary biliary cirrhosis by serum enhanced liver fibrosis assay. Hepatology 2008; 48(5): 1549-57.PubMed
- Nobili V, Parkes J, Bottazzo G, et al. Performance of ELF serum markers in predicting fibrosis stage in pediatric non-alcoholic fatty liver disease. Gastroenterology 2009; 136(1): 160-7.PubMed
- Hur M, Park M, Moon HW, et al. Comparison of non-invasive clinical algorithms for liver fibrosis in patients with chronic hepatitis B to reduce the need for liver biopsy: application of enhanced liver fibrosis and Mac-2 binding protein glycosylation isomer. Ann Lab Med 2022; 42(2): 249-57.PubMed